July sees the recommencement of nursery races, handicap races for 2-year-olds, with the first of them scheduled for Haydock and Carlisle this Saturday, writes Dave Renham. This article is the first in a two-part series that will look at these niche races. I have collated data from the last nine UK flat and all-weather racing seasons (2015 to 2023) with profits and losses quoted to Industry SP. I will quote Betfair SP where appropriate.
The market
My first port of call is the betting market and a look at some Starting Price bands. Let me focus first on a value metric, the A/E index:
As the graph neatly indicates, the shorter the price, the better the value. The only slight outlier is the 18/1 to 33/1 but, essentially, as the price gets bigger the value decreases.
If we now examine the Return on Investment (ROI%), we can see how well the two metrics correlate with each other:
Odds on shots have made a small profit, although there were only 131 such runners, so you certainly would not have raked it in! While I am not usually a fan of short prices, any horse priced 6/4 or shorter in a nursery is worth a second look. Conversely, performance dips when we hit 13/2 or greater, so nurseries look generally top-of-the-market orientated.
With shorter prices doing relatively well, let me dig into the results for favourites; one would surmise, given the data so far, that they are likely to be the best option in terms of market position. Here are the overall stats:
We have a strike rate of around three wins in every ten races, a good A/E index of 0.98 and minimal losses to SP. To Betfair SP, this loss would have become a £37.52 profit, giving a small +1.6% ROI. In addition, nursery favourites have performed better on the all-weather than they have on turf, as the stats below show:
Nursery favourites on the all-weather have edged into SP profit. To BSP, these figures improve to £61.43 (ROI +5.8%).
Another favourite angle I looked at was the going conditions on the turf. It seems the firmer, the better:
The good to soft or softer results may be because the market assumes that a young horse with limited experience can act on a softer surface when it has not raced on one before. This is just a theory. The good/firm+ and good ground results for favourites saw a small positive return to BSP.
The final favourite stat to share focuses on horses that had previously won twice as a 2yo. Of these 303 horses, 109 won (SR 36.0%) for an SP profit of £15.79 (ROI +5.2%). To BSP, this improved to a profit of £32.78 (ROI +10.8%).
Position Last Time Out (LTO)
I want to examine a recent performance metric, so let's investigate the position LTO stats.
The slight anomaly is the results for the 5th – they are out of kilter with the remaining ones. Overall, it seems the better value - or least worst, perhaps - lies with those runners who finished first or second LTO. If we look at the BSP returns for those finishing in the first two LTO, losses become very small at less than 1.5 pence in the £.
Sticking with those runners that were first or second LTO, if we restrict that LTO race to a nursery, we edge into BSP profit by £43.15 to £1 level stakes (ROI +1.7%). Essentially, I would view a run in the top two places LTO as a slight positive.
Weight carried
When I first came into racing, there was an old adage about backing the top weight in a nursery. I’m not sure how successful that may have been ‘back in the day’ before we had a wealth of weight stats to pore over. However, that is not the case now. Although top weights win more often than any other weight position, they would still have lost you nigh on 20p in the £ for every £1 staked. Below, I have looked at actual weight carried rather than position in the weights. When I talk about the actual weight carried, I take any jockey claim into account. Below are the ROI%'s for different weight groupings.
Across the board, we have losses to SP and, in some cases, significant losses. As a rule, the lower weights have returned more significant losses, and hence, I would be wary of backing a horse carrying 8st 9lb or less and ignore totally if they are under 8st. In fact, the 7st 13lb or less group won just 3.7% of the time, with an extremely poor A/E index standing at 0.55.
While discussing weight carried, let's compare the performance of jockeys in terms of claiming jockeys. Trainers use apprentices in handicaps to take weight off their horse's back which, in theory, should slow them down less during the course of a race. The quid pro quo is that these jockeys are less experienced than the ‘pros’. Here are the stats:
The more experienced the jockey, the better the win rate and the higher the A/E index. In terms of ROI%, the correlation with those two metrics is good, although 5lb claimers have lost 1p more in the £ than 7lb ones. The ‘top’ jocks (no claim) are close to breaking even when betting on BSP. Ultimately, I would be less inclined to back a horse in a nursery with a claiming jockey on board, especially one carrying 5 or 7lb.
Career Wins
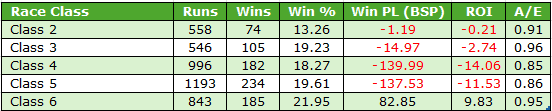
Earlier, I touched on the fact that two or more career wins when sent off favourite was a positive. So what about all runners in terms of career wins? Let’s look at the win and each way strike rates first:
In terms of win SR%, horses with two or more wins in their debut year have been the most successful. Those who are still maidens have struggled in comparison. When we look at the returns to SP, these correlate well with the win strike rates – the 2+ group would have lost you 13p in the £, the 1-win group lost 18p, and the 0 wins group lost 20p.
Sex of horse
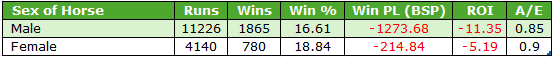
This is an area I like to look at because occasionally gender biases are unearthed. The vast majority of nurseries are for both sexes, and I have concentrated on those mixed-sex nurseries (roughly 1900 races over the study period). Here are the figures:
Male horses clearly come out on top across all metrics. When I learned this, I thought analysing nurseries with a similar split of male to female runners was worthwhile. I have looked at races where the split is no worse than 40% females versus 60% males and vice versa.
The bias toward male runners strengthens a little, especially considering the ROI%s. All things being considered, a male runner is a better nursery proposition than a female one.
Run Style
The final area to examine in this first piece is run style. I’ll begin by reviewing the win strike rate for the four categories geegeez.co.uk stores in its database: led, prominent, mid-division, and held up.
Based on all previous evidence I have shared regarding run style, these figures should come as no surprise. Let’s see if the A/E indices correlate:
The bias to early leaders/front runners in these contests is significant. As I have mentioned numerous times, the early leader will only be known a few seconds after the race has started. Hence, taking advantage of this run style bias is not easy. What the early leader conundrum does do, as far as I am concerned, is to continue my pursuit to find more accurate ways of predicting the early leader in run style-biased races. If your crystal ball had managed to predict all nursery early leaders since 2015, you would have made a profit of £701.95 (ROI +24.6%) to £1 level stakes. That equates to £7019.50 to £10 win bets.
**
Part 1 Summary
In conclusion, here are the key points:
1. The best value lies with shorter-priced runners - 6/4 or better / favourites.
2. Favourites have been profitable to SP & BSP on the all-weather and to BSP on good or firmer going. Favourites have also proved profitable to SP and BSP, with at least two previous wins.
3. Horses that finished 1st or 2nd last time out in a nursery have edged into BSP profit.
4. Horses carrying 8st 9lb or less have a relatively poor record; those carrying under 8st have an abysmal record.
5. Male horses outperform female horses.
6. Horses that lead early have a considerable edge.
And that wraps up part 1. In part 2 next week I will continue my digging into these nursery handicaps. Until then...
-DR
https://www.geegeez.co.uk/wp-content/uploads/2018/07/BillesdonBrook_Goodwood.jpg316830Dave Renhamhttps://www.geegeez.co.uk/wp-content/uploads/2022/10/geegeez_banner_new_170x78.pngDave Renham2024-07-01 14:14:032024-07-01 14:14:032-Year-Old Handicaps: Nurseries Part 1
A few months back, I looked at the performance of horses on their next start having had their last race at the Cheltenham Festival, writes Dave Renham. I will revisit that idea in this post but the focus now is on horses that raced last time out at Royal Ascot. Royal Ascot finished on Saturday so now is a great time to examine the numbers.
The data was taken from 2009 to 2024 (prior to this year's Ascot meeting), and profits and losses were calculated to Betfair Starting Price less a 5% commission.
All runners
Looking at all runners coming from Royal Ascot on their next start – they have scored 14% of the time with losses to BSP of 10 pence in the £.
Finishing position at Royal Ascot
My first detailed port of call is where the horse finished in their race at the Royal meeting. Let’s see the splits:
Last time out (LTO) winners and runners-up score better than one win in five on their follow-up run. LTO winners from two stables should be noted – firstly, Royal Ascot winners from the Aidan O’Brien stable have gone on to score next time 22 times from 55 runs (SR 36.4%) for a profit of £5.26 (ROI +9.6%; A/E 1.00). The Gosden stable has produced similar figures with 12 wins from 38 (SR 31.6%) for a profit of £3.95 (ROI +10.4%; ROI 0.98).
LTO runners-up have edged into profit, but this is down to one huge-priced winner (BSP 75.0), which completely skews the figures. Ultimately, finding an edge from where they finished in their Ascot race seems complicated.
One interesting comparison to make is between the performance of horses that beat more than half of their Royal Ascot rivals (excluding winners) and those who beat fewer than half of them. Below is a graph comparing win and each way (win & placed) strike rates for both groups:
As you can see, horses that finished in the top 50% of runners in their Ascot race have completely outperformed those that did not in strike rate (both win and each way). They would also have lost you 6p less for every £1 bet compared to the 0 to 49% group.
Digging a bit deeper, if we restrict this 50% to 99% group to those that ran in Royal Ascot handicaps, these 1360 qualifiers would have turned a profit of £84.50 (ROI +6.2%). These handicap stats are not hugely skewed by the winning prices either.
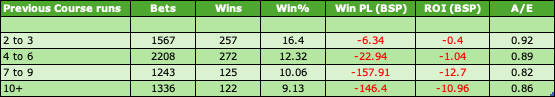
Course (next time)
Course data next. Which courses fare better than others when Royal meeting runners visit on their follow-up run? Here are the courses that have had at least 100+ qualifying runners:
Five courses have turned a profit: Chester, the Curragh, Haydock, Newbury, and York. The Newbury results include three winners priced between 40.0 and 60.0 BSP, so this profit figure can be ignored. Meanwhile, York had a massive 200.0 BSP winner, so this is the second course to have unreliable BSP profit figures. Sticking with York, horses that raced next time at the York Ebor meeting in August have an abysmal record with just 17 winners from 210 (SR 8.1%) for a BSP loss of £90.07 (ROI -42.9%). The A/E index stands at an extremely low 0.60. The other three ‘positive’ courses (Chester, the Curragh, and Haydock) have not had their results badly skewed, and visits to these courses after Royal Ascot can be viewed as a positive. Haydock figures, I would say, are the most reliable as they managed a profit to Industry SP.
The Goodwood next time stats are poor. Most of these qualifiers appeared at Glorious Goodwood – 724 of the 768 runners. Of these, just 78 won at the Goodwood Festival for losses of £190.40 (ROI -26.3%). Personally, I would ignore the vast majority of LTO Royal Ascot runners reappearing at Glorious Goodwood.
Before moving on, it looks best to disregard horses that switched from the turf of Ascot to the all-weather on their next start, as their combined figures read a disappointing 52 wins from 369 runs (SR 14.1%) for hefty losses of £133.56 (ROI -36.2%).
Days since the Ascot run
Let me now examine the performance of these Royal Ascot runners based on how quickly they return to the track. Below is a graph mapping their A/E indices:
Horses returning to the track between 8 and 14 days later have provided the best value. So, keep an eye on them in the next few days. On average, per year, 40 to 45 horses return to the track within that time frame. They have won just over 18% of their follow-up starts. They have not been profitable if backing ‘blind’, but they are horses that undoubtedly require a second glance. Horses off the track for more than four months (121 days +) have offered the poorest value and have the lowest strike rate amongst all groups.
Class Change
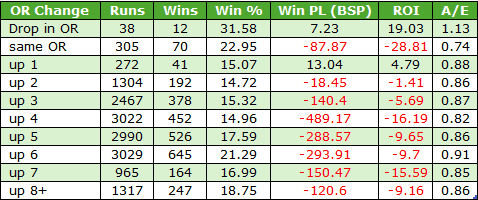
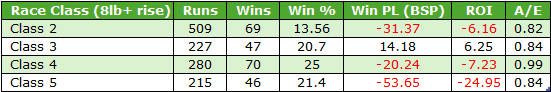
A look at Change in Class of race next – here are the splits:
Clearly, horses dropped in class have by far the best record, with comfortably the best strike rate and losses at just 4.1% compared with 17.7% and 19.9%, respectively.
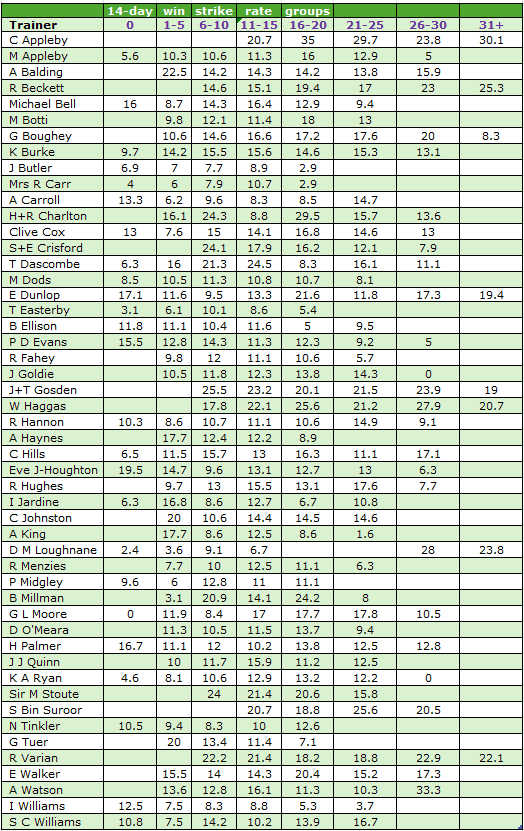
Trainers
It's time to look at the performance of trainers. A tiny proportion of horses switch trainers after Royal Ascot, so the data I am sharing is based on trainer results, with horses running for the same stable as they did at the Royal meeting. Here are all trainers with at least 70 LTO Royal Ascot qualifiers. They are in order by win-strike rate:
Two trainers have impressive A/E indices, with horses having their first start after Royal Ascot: Bin Suroor (1.19) and Fahey (1.06). Runners from both stables are worth keeping a close eye out for. Five trainers have made a profit, but to try and avoid big-priced winners skewing the figures, let me show the performance of the trainers above if we restrict their runners to those who started in the top four of the betting on their next start:
This table is a better one to concentrate on from a trainer's perspective. The top six have some excellent stats regarding strike rate – all have proved profitable, and four (Bin Suroor, Cox, Fahey, and Beckett) have A/E indices above 1.00. It is interesting to see Charlie Appleby's very modest figures, as he is usually a trainer who has excellent stats.
Additional Stats
1. Horses whose SP was 7/2 or shorter at Royal Ascot have gone on next time to win 83 times from 302 runners (SR 27.5%) for a minimal loss of £4.58 (ROI -1.5%).
2. In contrast to the first additional stat, horses whose SP was 40/1 or bigger at Royal Ascot have won next time 166 times from 1679 runners (SR 9.9%) for significant BSP losses of £323.47 (ROI +19.3%).
3. 2yos beaten more than five lengths at Royal Ascot have struggled next time out, scoring 15.9% of the time and losing over 23p in the £ to BSP. Compare this to the 2yo winners from the Royal meeting who have gone on to win over 30% next time out, losing just 3p in the £.
4. 3yo Royal Ascot winners have gone on to win next time in 35 races from 148 starts (SR 23.7%) for a break-even situation.
**
Conclusion
It is challenging to make blind profits using a specific angle from LTO Royal Ascot competitors. However, based on all the findings, I feel LTO handicappers are worth keeping a close eye on as long as they didn't win and beat at least 50% of their Royal Ascot rivals. Several will pop up and win next time, many going under the radar.
Regarding trainers, Saeed Bin Suroor and Richard Fahey head my list, with Ralph Beckett and Clive Cox close behind. This is especially true if their Royal Ascot runners start in the top four of the betting next time.
Horses heading to Haydock after Ascot and those making their trips to Chester and the Curragh have done well. I would be wary of any Royal Ascot runner reappearing for the first time subsequently at Glorious Goodwood or the York Ebor meeting.
Horses dropping in class are far more likely to win than those which do not. Finally, horses returning to the track 8 to 14 days after their Royal Ascot spin are the best-performing group regarding time off since their Ascot run.
-DR
https://www.geegeez.co.uk/wp-content/uploads/2024/06/BedtimeStory_Chesham2024.jpg319830Dave Renhamhttps://www.geegeez.co.uk/wp-content/uploads/2022/10/geegeez_banner_new_170x78.pngDave Renham2024-06-24 18:19:122024-06-24 18:19:12What Happens After Royal Ascot?
By the time you read this, Royal Ascot will be just days away, writes David Renham. It is one of my favourite meetings of the year, and I am guessing that will be the same for many readers. In this article, I will delve into Royal Ascot data going back 15 years (2009-2023) in preparation for the upcoming festival. Any profit/loss has been calculated to Industry SP, but I will quote Betfair SP where appropriate. My focus will be exclusively on Royal Ascot's mile handicap races.
There are four one mile handicaps scheduled for this year’s meeting: the Royal Hunt Cup, Britannia, Sandringham, and the relatively new Kensington Palace. The first three are run on the straight course; the Kensington Palace transpires on the round course. These races tend to have big fields, especially the straight-track ones. Going back to 2009, 41 of the 49 mile handicaps at the Royal meeting have seen at least twenty runners go to post. Only one of these took place on the round course.
Market Rank
Firstly, let us look at the performance of different positions in the market. Any ‘joints’ have been combined, so when it says ‘favourites’, it includes joint favourites. I have added each way percentages as many punters bet each way in big field handicaps:
It is interesting to note how well favourites and second favourites have fared, scoring in 17 of the 49 races. This equates to winning 34.7% of the races from just 8.7% of the total runners. If you focused on clear favourites, their results improved to 9 wins from 43 (SR 20.9%) for a profit of £6.75 (ROI +15.7%). Betting to BSP would have slightly improved matters to +£10.02 (ROI +23.3%). From a place perspective, it certainly looks worth considering putting either the favourite or second favourite in any placepot perm.
Horses outside the top ten in the betting have a poor record, as you would expect. Big-priced winners will occasionally pop up, but losses of over 65p in the £ for these outsiders do not inspire me too much to look beyond the more obvious. The biggest-priced winner has been 40/1 (Rising Star in the Kensington Palace in 2022), and she is the only winner from 357 horses that have started 40/1 or bigger.
Race Type Last Time Out (LTO)
Looking at the type of race these runners ran in last time out has uncovered a potential edge as the table below shows:
Horses that contested a handicap last time have a much better record than those who raced in a non-handicap. Regarding Betfair SP returns, LTO handicap runners lost less than 1p in the £, while LTO non-handicap runners lost a whopping 53p in the £.
Beaten Distance Last Time Out
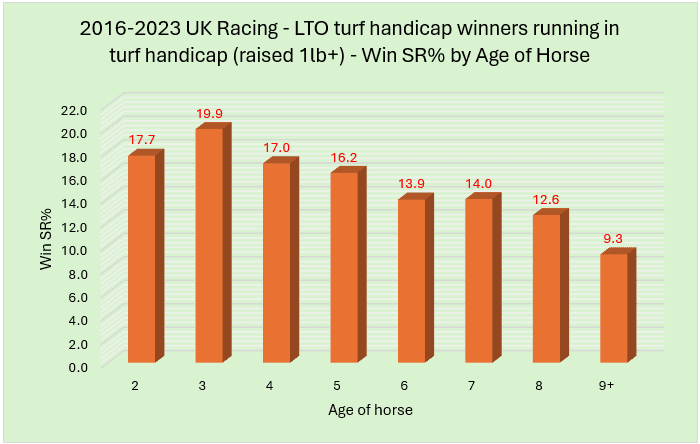
My next port of call is to look at LTO performance, focusing on how far horses were beaten. The graph below looks first at the win strike rate (LTO winners are grouped with horses that were beaten less than a length):
Winners/horses beaten less than a length LTO have certainly got the better of the ‘battle’ from a win strike rate perspective. How does that equate to returns to SP? Here are those findings:
We see a good correlation here with the previous graph—losses of around 13p in the £ for LTO winners/horses beaten less than a length. In fact, at BSP, this 13% loss became a 12.5% profit. In contrast, there have been enormous losses for horses that were beaten one or more lengths in that most recent spin.
Finally, for this section, a look at the A/E indices:
There is a further positive correlation here, and all the data gathered points to keeping a close eye on any LTO runner that won or ran the winner to less than a length.
Market Rank LTO
Whenever I am interested in backing a horse, I always look back at their last run's price or market position. Indeed, personally, I often look at their previous three or four races in terms of odds/market rank. Hence, I thought seeing what I could find for these Ascot races would be worthwhile. Here are my findings:
As you can see, the percentage play is to be backing horses in the top five of the betting LTO rather than those 6th or higher on their most recent outing. They are better value; they have more chance of winning and more chance of getting placed. Regarding BSP returns, horses first to fifth in the betting last time would have lost you 13p in the £, and those 6th+ would have stung you for 41p in the £.
Draw Position
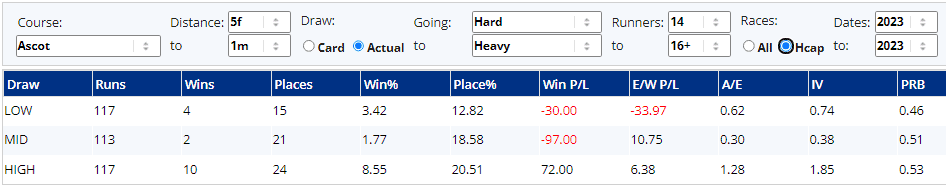
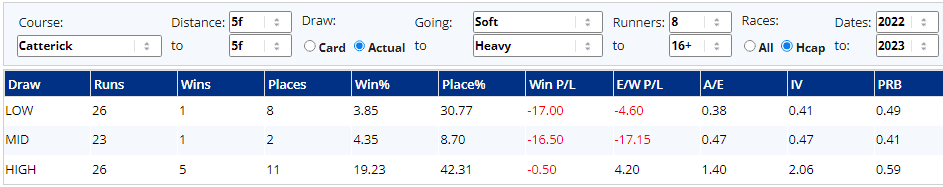
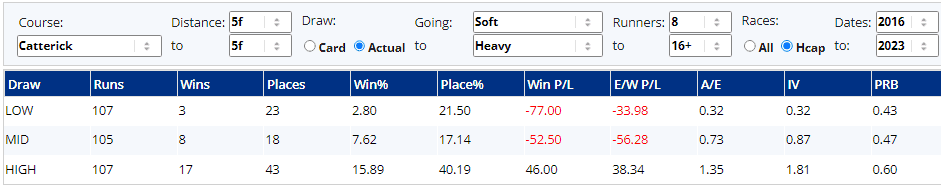
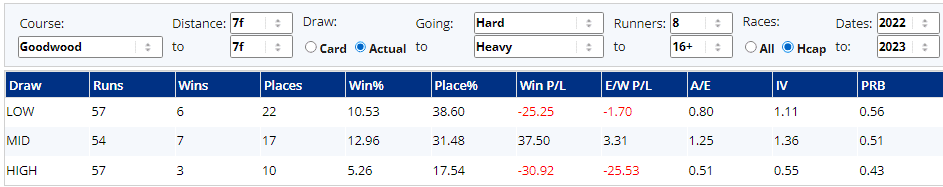
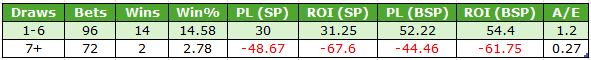
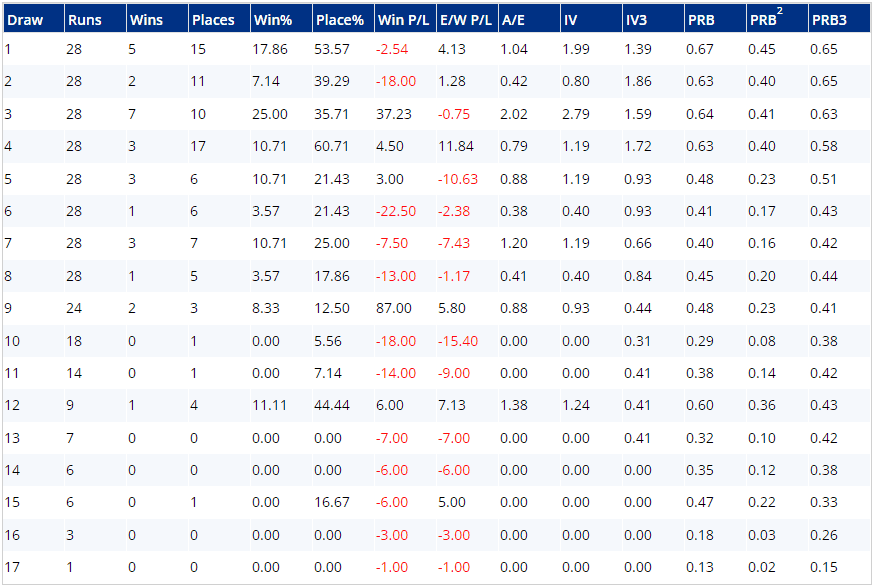
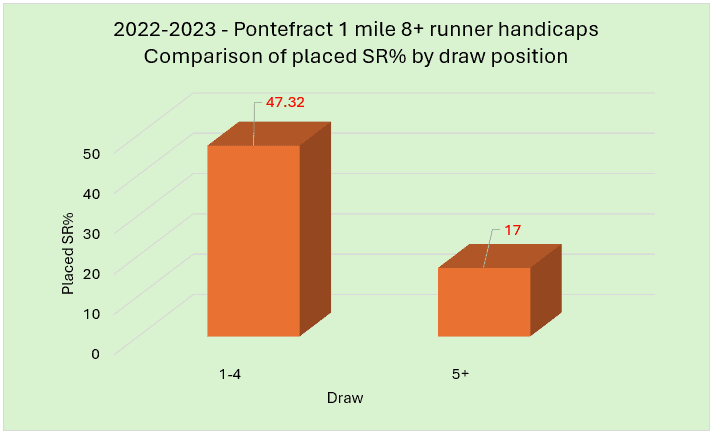
The draw in big field straight course races at Royal Ascot has been discussed in past articles, including this one. Arguably, it can be the most important factor, especially if one section of the track seems to be at a significant disadvantage. Here is some draw analysis of the last nine Royal Ascot straight track mile handicap races, covering the years 2021 to 2023:
Taking all nine races in combination, a draw in the top half (middle to high) has tended to be favoured.
There are other big field handicaps run at the meeting, including the Wokingham over 6f and the Buckingham Palace raced over 7f. Last year, both these races displayed a higher draw bias, so taking these two races in conjunction with the three mile straight track handicaps, you have to conclude that higher draws generally held sway at the 2023 Royal meeting.
What will happen this year? Well, that is the 64-million-dollar question. Only time will tell...
Running Style
Onto an area that is finally starting to get more attention from the racing press, and it is one I have been championing and studying for a long time. For this section, I have focussed on the forty 1-mile handicaps with the most extensive fields (20+) run on the straight course, contested between 2009 and 2023.
21 of the 40 races (52.5%) were won by a horse that was held up early in the race. Hold-up horses account for 36% of all the runners, so they have won around 1.45 times more than they statistically should. It should also be noted that hold-up horses have been twice as likely to get placed compared to prominent runners.
I thought comparing the Percentage of Rivals Beaten (PRB) for all running styles in these 20 runner+ straight course races would be useful. Here are the splits:
Based on the data shared previously, it is no surprise to see hold-up horses comfortably doing best.
As we have already seen, these races contain plenty of big-priced runners/outsiders, so below I have narrowed down the run style data and homed in on those runners that started at 20/1 or shorter. Did the PRB figures project a similar trend? Here are the splits:
We see the same pattern as before. Hence, looking at both sets of figures, the ‘ideal’ type will be a horse that comes from off the pace and delivers a challenge late, be it from a position near the back early or from a more midfield sit.
**
Summary
These big field mile handicaps certainly seem to have some general trends that we can apply to all four races. This is even though all four have differences (e.g. sex of runners, age restrictions, etc). In terms of the general trends, favourites and second favourites perform above expectations; last time winners or those beaten less than a length have proved much better value than those beaten LTO by one length or more; horses that ran in a handicap LTO have outperformed those that ran previously in a non-handicap; horses that were in the top five of the betting LTO are better betting propositions than those who were 6th or bigger in the betting.
As regards the big field straight course handicaps, we can add that a higher draw has been preferable recently, but it is important to keep an open mind. In terms of run style, the winners will typically race mid-pack or towards the back early.
-DR
https://www.geegeez.co.uk/wp-content/uploads/2023/06/RoyalAscot_marco.jpg320839Dave Renhamhttps://www.geegeez.co.uk/wp-content/uploads/2022/10/geegeez_banner_new_170x78.pngDave Renham2024-06-10 18:02:332024-06-10 18:02:33Statistical Guide to Royal Ascot 2024 Mile Handicaps
In recent weeks, I have been looking at ‘exotic’ bets, writing two articles on the trifecta/tricast and one on the Exacta/Computer Straight Forecast (CSF), writes Dave Renham. This is the second part of looking at the two 1-2 bets of the Exacta and Straight Forecast.
In the first article, Exacta looked like the better option, coming out on top nearly 62% of the time. In addition, the average payout was bigger for the Tote bet, and virtually every course saw the Exacta outperform the CSF. It was also noted that the edge for the Exacta increased as the field size grew. For example, races of 17 or more runners saw a 57% edge for the Exacta based on average payouts. In this article, I will continue my research with the same six-month data set to determine other valuable facts.
Courses Revisited
In the first article, I compared individual courses in terms of which of the two bets came out on top more often. I did this for races at both National Hunt courses and Flat ones. This time, I will compare the average payouts of the two bets, starting with the flat. There must be at least 30 qualifying races to be considered:
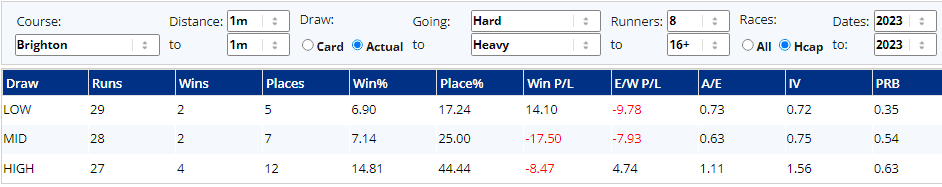
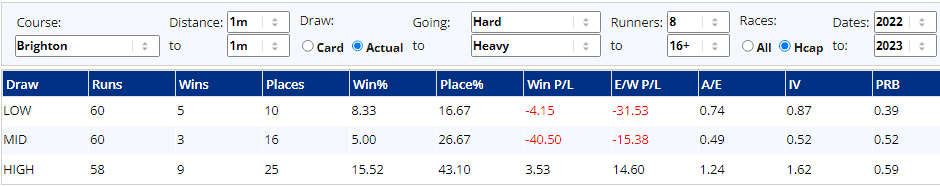
The Exacta ‘beat’ the CSF 34-3 – the three ‘wins’ for the CSF are highlighted in red (Brighton, Chester, and Hamilton).
In the first article, it was noted that the edge at Irish courses in terms of average payouts/dividends was nearly double that of UK ones, and this is borne out again with some significant differentials in qualifying Irish courses. Of the six that made the list, five of them – Cork, the Curragh, Dundalk, Gowran Park and Leopardstown all saw the Exacta’s edge standing at over 25%. On the UK side, Ascot had a considerable edge over the Exacta, which was expected considering the Royal Ascot stats I shared last time. York, Doncaster and Newbury were the next best three.
To the NH course averages now. As before, to qualify, a course must have had 30+ qualifying races:
The Exacta has come out well on top again, with just three courses (in red) seeing a ‘win’ for the CSF. There are very positive Exacta figures at Punchestown and Cheltenham, while 15 courses saw an edge for the Exacta of over 20%.
The Kilbeggan stats caught my eye immediately, where the CSF average was nearly double the Exacta. However, digging into the course results, I noticed a race I had not previously noted where the Exacta had not won. It is the only race of 6000 odd races I’ve analysed where no punter chose the correct 1-2 combo. The CSF paid a massive £3206.34 as a 66/1 horse beat a 200/1 shot into second place. That explains it!
Day of the Week
While researching this, I speculated whether the day of the week made a difference. For example, I wondered if Saturday, as generally the busiest day, would potentially offer the Exacta more of an edge. I also wondered if the reverse was true on Sundays. On average, Sunday is the quietest day regarding the number of meetings, so I hypothesised that the Exacta edge would be less. Therefore, let me compare the seven days of the week to which of the two bets came out on top more often. Here is what the numbers told me:
So, my Sunday theory proved correct, but not the Saturday one. Indeed, Saturday was only the 6th ‘best’ day for the Exacta. Monday and Tuesday saw the Exacta ‘beat’ the CSF more often, albeit there is not a massive difference between the best day of Tuesday and the worst of Sunday.
Price of winner
I wanted to see the effect of the winner's price on which of the two bets came out on top more often. This is graphed below using Industry SP price bands:
The graph shows that the shorter the winner's price, the more competitive the CSF was. Indeed, the CSF edged it for horses priced Evens (2.0) or shorter. However, once the price got to 100/30 (4.33) or bigger, there was only one winner, and it was a comfortable one at that. For those who prefer looking at these comparisons in a table, here are the same figures from the graph.
Once the winner's price hits 17/2 (9.5) or bigger, then the Exacta has ‘won’ more than three times as often as the CSF.
Strongest ways to utilise the Exacta edge
In the two articles, Exacta has had the edge over the CSF in most circumstances. We have just seen that this edge is very strong when the winning price hits 17/2 (9.5) or bigger, and in the first article, I shared the fact that the bigger the field, the better as far as the Exacta goes. What about combining the two? Hence, what were the results when the winning SP was 9.5 or bigger, and the number of runners was 17 or more? Well, I can share that with you now. There were 108 races where both parameters were met, and firstly, here are the results in terms of which of the two bets came out on top more often.
The Exacta beat the CSF in 102 of the 108 races, equating to a percentage of close to 95. That is somewhat one-sided!
A look at the average payouts now over these 108 races and, as expected, the Exacta’s figure is much higher:
Under these circumstances, the Exacta has had a 67% edge in payouts/dividends.
Hence, if you fancy a horse destined to start around 17/2 or bigger in a big field race and want to predict a 1-2, you’d be mad to choose the CSF based on this evidence.
Cutting the number of runners to 14 or more plus a winning SP of 9.5+ still gives you a massive edge, with the Exacta beating the CSF in 254 of these 285 qualifying races. That equates to 89.1% of races where the Exacta prevailed.
I did one more tweak to this runner/SP combo, looking at 14+ runner races where the winner was priced 6/1 (7.0) or bigger. Thanks to 366 wins from 410 races, the Exacta win percentage over its counterpart is maintained at 89%, with the CSF prevailing on just 44 occasions.
Before finishing, let me share one more useful nugget about utilising the Exacta edge. This comes when examining the results in terms of where the favourite finished. The table below shows which of the two bets came out on top more often.
Clearly, having the favourite in second in an Exacta is a good strategy, especially when attempting to beat the CSF. The percentage edge for Exacta over the CSF when the favourite places second is just under 30%.
**
Summary
The second article confirms the findings from the first: that is, the Tote option, the Exacta, has a solid overall edge over the CSF. Considering both articles, this edge increases most in races with bigger fields and when the winner’s SP is bigger (specifically 14+ runners, 6/1+ winning SP gives an 89% 'win' for Exacta over CSF).
The Exacta's edge is also stronger in Irish races and when the favourite finishes second.
Finally, the eagle-eyed may have noticed that no data was shared for Haydock or Sandown. This was, unfortunately, due to an issue with my databases and spreadsheets. I need to manually add the data for both of these courses when I have time, and when I do, I’ll report back in the comments. Looking at the results I have (about 35% of them), both Sandown and Haydock offer a decent edge for the Exacta in line with other courses of a similar profile.
-DR
https://www.geegeez.co.uk/wp-content/uploads/2019/07/Enable_CrystalOcean_KingGeorge2019_830x320.jpg320830Dave Renhamhttps://www.geegeez.co.uk/wp-content/uploads/2022/10/geegeez_banner_new_170x78.pngDave Renham2024-06-04 14:52:072024-06-04 14:52:07Comparing Exacta and Computer Straight Forecast: Part 2
This article continues further research into ‘exotic’ bets, with the focus switching to predicting two horses to come first and second in a specific race, writes Dave Renham. As with the 1-2-3 trifecta and tricast bets, punters in the UK and Ireland have two options, namely the Exacta and the Computer Straight Forecast (CSF). The Exacta is a pool bet available with the Tote, while the CSF is a bookmaker bet that, like the tricast, has the payout/dividend calculated by a computer formula.
In this piece, I will compare the two to see if one is better than the other or at least one is better under certain circumstances.
With the Computer Straight Forecast, there is a method that you can use to estimate the likely payout for most races once you know the SPs. Essentially, you take the winner's price, add one point to the price of the second-placed horse, and multiply them together. Hence, in a race where the winner is 3/1 and the second is 5/1, you multiply 3 by 6 (5+1), and the forecast will pay around £18.00. Here are a couple of recent examples to help illustrate this. The first was a race at Windsor on 20th May:
Using the estimating method, the payout should be around £48.00 (4 x 12), and as you see, the CSF paid £47.18. A second example comes from the same day at Carlisle:
This time, the rough payout calculation is around £25 (2.5 x 10), and once again, the estimate is within £1 of the actual payout, which was £25.79.
Therefore, as a punter we can have a relatively good idea of this potential payout pre-race if we leave our CSF bet as close to the ‘off’ as possible and by having the latest live bookie odds to hand. These odds should be very close to the actual SPs, so a quick calculation can help us decide whether we feel the probable odds justify the bet.
As far as predicting the likely payout of the exacta pre-race, one can often have a rough idea, too. This is because the Tote Pool Exacta Info can be accessed live on the net. However, they will only show the most popular exacta combinations, so you may not see your preferred combo in big fields. Being a pool bet, these dividends/potential payouts are continually changing. Still, when you get very close to the ‘off’, and if the pool is a decent size, any late changes in potential exacta dividend will be quite small. This is unless someone places a late exacta bet with a decent stake, which, fortunately, is quite rare. Like with the late placement idea of the CSF, late exacta placement is possible if your combination is shown on the Tote screen. If it is, then this gives you a decent prediction of the likely dividend to again help you decide whether the bet is value or not.
It's time to review some history. The data for this article has been taken from six months of UK and Irish racing spanning from 1st January 2023 to 30th June 2023. This includes National Hunt racing, All-Weather flat, and Turf Flat, with the proviso that races must have at least five runners. I have ignored any race with a dead heat for the first or second, as the payout gets split and messy.
Average Payouts (Overall)
First, let me compare the average payouts for the CSF and the Exacta from the six months of qualifying races, of which there were nearly 6000 in total. The figures are rounded to the nearest pound:
As with the trifecta/tricast research, the Tote bet, in this case, the Exacta, has come out on top. The Exacta ‘edge’ has averaged out to just above 19%, a significant difference.
Average Payouts by Race Code
I now want to look at the average payouts across the three race codes: National Hunt, All Weather Flat, and Turf Flat. Here are the splits:
The Exacta trumps the CSF in all three, but the edge has been less pronounced in all-weather racing. However, these initial findings suggest that the Exacta is a better value option than the CSF across all codes.
Race by Race Comparisons
Let me compare race by race, which came out ‘on top’ with the bigger return/payout more often. Races where the payout had a differential of less than 10 pence, I have called ‘ a draw’:
Having already seen the average payouts, these percentages will be no surprise. The difference is not as pronounced as we saw in the trifecta/tricast battle, but again, when taking a general view, the Exacta offers the better option.
Average Payouts UK v Ireland
I’m back comparing average payouts/dividends with a look now at UK average payouts versus Irish ones. Here are the figures:
As the figures show, the payouts have been much higher in Ireland. However, the main reason for this is Ireland's bigger average field size. The average number of runners in Ireland during these six months was 12, compared with an average of just 9 in the UK. Regarding the percentage edge to the Exacta versus the CSF, Irish races have seen a much more significant advantage using the Tote bet.
Average Payouts by Field Size
Sticking with the field size/number of runners angle, let's examine the average payouts for both bets to see if the Exacta edge increases as the field size does. I have split the results into the following field sizes: 5 to 7 runners, 8 to 10, 11 to 13, 14 to 16, and 17 or more. The blue line represents the Exacta and the orange line is the CSF:
The smallest field has just favoured the CSF, with the bookie’s bet having a slight 4% edge over the Exacta. However, this is the only ‘win’ for the CSF as the edge for the Exacta increases as the field size increases:
As you can see, the number of runners significantly impacted how the Exacta matched up with the CSF. There is a 32% edge for the Exacta when we get to 14-16 runner fields; once we go 17 or more, the edge is nudging 60%. Essentially, the bigger the field size the better as far as the Exacta is concerned. I, for one, will not be contemplating CSF bets instead of Exacta bets in races of 11 or more runners. I would be mad to do so based on these findings.
There were 233 qualifying races with 17 or more runners, of which the Exacta paid more than the CSF in 210–this equates to just over 90% of these races.
Average Payouts by Race Type
My next port of call is to examine the difference between handicaps and non-handicaps by comparing the average payouts/dividends of the two bets. Here are my findings:
Handicap payouts/dividends are higher for both, but in terms of Exacta's ‘edge’ over the CSF in handicaps vs non-handicaps, it is just 0.3% - essentially the same. However, to try and get greater insight, let me split the results down into more specific race types:
I had expected handicap hurdle races to show the most significant edge for the Exacta because these races tend to have bigger fields, but novice hurdle and chase races have edged it. National Hunt Flat races have seen the smallest edge for the Exacta over the CSF at only 5%.
Average Payout by Racecourse
For the last part of this first article, I will look at how the Exacta and CSF played out at different tracks. I will begin this section by sharing flat/AW courses with 40 or more qualifying races, giving us a good sample size. It includes all races, so a mix of handicaps and non-handicaps. Therefore, let me compare course by course, which of the two bets came out on top more often. I have listed the courses in alphabetical order:
The six courses highlighted in red (Ascot, Bath, Gowran Park, Leopardstown, Musselburgh, and York) are those where the Exacta prevailed in at least 70% of races. Bath narrowly missed out by half a percent. The two courses in blue, Hamilton and Leicester, were the only two where the CSF beat the Exacta more often.
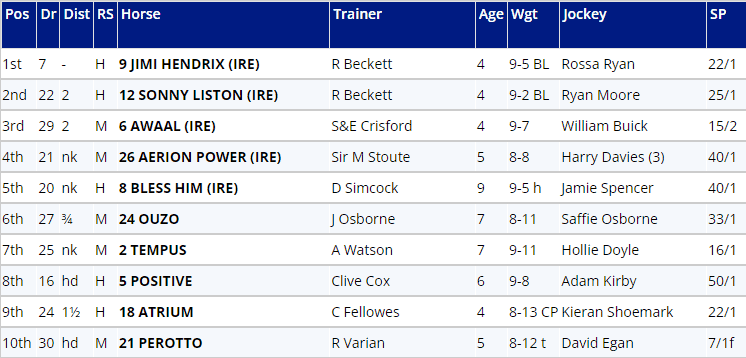
I'm sticking with Ascot because, with Royal Ascot just around the corner, I thought it would be interesting to look at the 2023 results to hopefully give us some pointers for the 2024 meeting. Here are the individual Exacta/CSF payouts for all 35 races (The rows in red are where the Exacta payout was bigger than the CSF one):
There were 31 wins out of 35 for the Exacta (88.5% of races), just three wins for the CSF and one ‘draw’. In 9 races (25.7% of races), the Exacta payout was at least double the CSF. 11 of the 12 handicaps (91.7% of races) saw the Exacta do best, of which 4 (33.3% of races) saw the Exacta paying more than double.
The average payout across all races for the Exacta was £400; for the CSF, it was £230. However, these averages were both badly skewed by the result of the first race on 22nd June, where a 150/1 shot prevailed. In that race, the CSF paid £3478.24; the Exacta £5369.6. Taking that race out, the average payouts over the other 34 races were – CSF £135 and Exacta £253.
The message is clear: if you plan to try and predict the first two home in a Royal Ascot race this year, the Exacta is by far the best option.
Moving away from the flat, let's review the same statistics for National Hunt course results (minimum 40 races):
Cheltenham is the only other track to have exceeded 70% for Exacta ‘wins’, while three have seen the CSF edge it: Fontwell, Ludlow, and Stratford.
**
Summary
It is time to wind up this first half of my comparison of Exacta and CSF, with more to come in a follow-up piece next time. At this juncture, Exacta is holding a healthy lead over the CSF. I expect that to continue next time, although I am currently still in the research phase of part two, so let's keep an open mind for now!
-DR
https://www.geegeez.co.uk/wp-content/uploads/2024/05/TripleTime_Inspiral_QueenAnneStakes_RoyalAscot2023.jpg319830Dave Renhamhttps://www.geegeez.co.uk/wp-content/uploads/2022/10/geegeez_banner_new_170x78.pngDave Renham2024-05-28 09:51:512024-05-28 09:53:17Comparing Exacta and Computer Straight Forecast: Part 1
This is the second article in which I have compared two exotic bets - the tricast and the trifecta, writes Dave Renham. The trifecta was the better option in the first piece, which you can read here, considering all qualifying races. It paid out more than the tricast in roughly eight out of every ten races. In this follow up, I will share some more of my findings.
The data was taken from UK and Irish turf flat handicap races run in 2023, in which there were between 10 and 14 runners. As I mentioned last time, this amounts to just over 1000 races, and I have excluded any race where there was a dead heat in one of the first three positions as the payouts get split. I have also excluded races where there was no trifecta payout. This happens occasionally when the pool size is small, and the first three horses home were unfancied/decent prices.
The first piece examined general comparisons and then delved into individual course data. In this piece, I will revisit some course data and examine some Starting Price data.
Trifectas at Specific Racecourses
In the first article, I compared average course payouts for trifecta and tricast and how often the trifecta ‘beat’ the tricast in percentage terms. Here, I want to share some findings regarding how frequently one of the bets paid at least twice as much as the other.
Looking at all 1011 qualifying races, the trifecta paid at least double the tricast on 145 occasions, and the tricast paid at least double on only 20 occasions. Hence, 14.3% of all races saw a trifecta payout of at least double the tricast (2% of races for tricast at least double the trifecta). Below is an individual course breakdown showing the percentage of races where the trifecta paid at least twice the tricast dividend. They are listed with the biggest percentages at the top.
The top three are all Irish courses, which is interesting. The Curragh tops the list, with the trifecta being twice or bigger than the tricast in roughly three out of every ten races. For those who remember some stats from the first article, the Curragh had the highest percentage differential when comparing average payouts. Hence, seeing the course also tops this list is no real surprise.
Chester lies at the bottom of the table, and I wonder whether this is due to the well-known low draw bias, especially over shorter distances. I can imagine, for example, that horses drawn 1 and 2 would appear in punters’ trifecta bets more often than at most other courses. Therefore, with the trifecta bet being a pool bet, if either or both draws 1 or 2 finish in the first three, the returns will be lower because of the extra money placed on these draws. I cannot categorically prove this, but that is my theory.
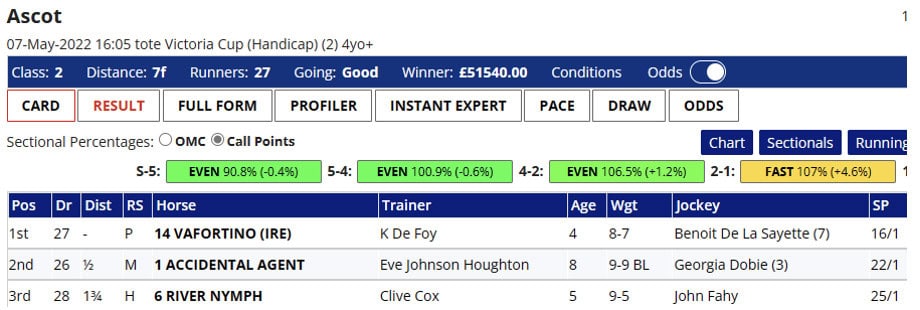
While discussing draw bias, the draw can also affect the computer-generated calculation on tricast payouts when three horses drawn close together finish in the first three. I am unsure how the deduction is calculated, but a serious one can occur. Let me give you an example of such a situation. The 2022 Victoria Cup had the following result:
The first three finishers came from the three highest draws. Usually, with prices of 16/1, 22/1, and 25/1, I would estimate that the tricast would pay around £8700 to £9300. However, on this occasion, the tricast paid just £4377. This is a clear example of where a draw-biased race sees a much lower return.
I tried to find another big field handicap where the prices of the first three were the same, and there was no draw bias in play. The closest I could find was the result of the Ebor handicap at York in 2019.
Hence, the 1st and the 3rd prices were the same in both races, but the second was three points bigger at 25/1. The tricast, on this occasion, paid £9605. Given the slightly higher price for the second-placed runner, I would estimate the payout may be bigger by a few hundred quid. However, the York payout was over £5000 higher than the Ascot one, which helps demonstrate that draw bias tricasts can be severely compromised.
Impact of odds of horses in the first three
I would now like to share my findings related to the prices of the runners within the first three finishing spots. I will start by looking at the winner's price and see what effect that had on which of the two bets came out on top more often.
As the first line of the table highlights, when the winner was a short price, 2/1 or less, the trifecta win percentage dropped somewhat. The first article noted that the trifecta outperforms the tricast just over 80% of the time but drops to just over 70% here. However, the reverse was true when an outsider took the first spot with winners priced between 20/1 and 28/1, with the trifecta prevailing 85.4% of the time, and winners priced 33/1+ seeing that figure rise to 89.5%.
These figures suggest that trifecta bettors overbet short-priced runners, at least when placing them in first position in their 1-2-3 bet. In contrast, bigger-priced horses are underplayed in terms of being placed in the first position of trifecta bets. Placing runners priced 2/1 or shorter in the first position of your trifecta bet will yield more winning bets, but one could argue that the better value lies with bigger-priced runners placed in that first spot.
Now I will try a similar idea, investigating what percentage of races saw the trifecta beat the tricast based this time on the prices of the second-placed horses. The graph below shows the percentage of the races where the trifecta came out on top:
The graph illustrates that, in general terms, the trifecta’s edge over the tricast drops as the price of the second-placed runner increases. The two have no perfect correlation, but the trend is clearly downward.
These figures suggest that putting shorter-priced runners in the second spot in the trifecta is a good idea. This time, bigger-priced runners (20/1 plus) finishing second are not so ‘trifecta friendly’.
Time to share this type of data for horses that finished third:
We see a similar pattern to the second-placed results. Shorter prices in the third spot considerably improve the chances of the trifecta payout exceeding the tricast one. In contrast, horses finishing third and priced 20/1 or bigger see the trifecta edging closer to parity with the tricast.
The ‘price’ findings across all three finishing positions suggest that trifecta bettors can improve their chances even further of getting the bigger payout between the two 1-2-3 bets by considering prices in conjunction with the finishing position. Therefore, one would surmise that trifecta bettors could potentially increase their returns as well if adopting such considerations.
Of course, instead of a single-position price analysis, we should look at combinations of prices for the first three finishing positions. I have started to do this, but even using the price brackets from earlier, there are far too many potential combinations to crunch and analyse. Also, many such combinations would have occurred very rarely over these 1011 races, and hence, those findings would not be statistically significant. Consequently, I have looked at a few more ‘general’ cases.
General Case Studies
Case 1 – The top three finishers are all priced 11/2 or shorter
This scenario occurred in 60 races, so it has a good sample size. Here are the percentage splits for which of the two bets came out on top more often.
A resounding success for the trifecta was when all three runners were at or near the head of the market. Now, a look at the average payouts of the two bets when these prices occurred:
On average, the trifecta has paid £37 more than the tricast, which equates to a 50% edge. Therefore, when the prices of the runners in your proposed 1-2-3 bet are within these parameters, you should use the trifecta.
Case 2 – The top three finishers are all priced 17/2 or bigger
This time, the prices of all three finishers are much higher. Indeed, 97% of all horses priced 17/2 or bigger from these races were outside the top four of the betting. Hence, this is quite an unusual occurrence and as a result we have only 28 qualifying races. So, this is a smallish sample, but let’s see what the stats say, starting with the percentage splits for which of the two bets came out on top more often.
We see quite a different picture compared with the 11/2 or shorter results. The tricast came out on top more, albeit the difference equated to just one race (14 ‘wins’ to 13).
Onto the average payouts now:
A second win for the tricast averaging £377 more, giving the tricast close to a 13% edge per bet (on average).
However, I must share some extra information as two tricast payouts in this subset were unusually high. The first, at Newbury, saw the tricast pay £11,662, and the second, at Windsor, paid £16,900. The trifecta payouts, in comparison, were much lower - £6373 at Newbury and £5547 at Windsor. Taking those payouts away, the remaining 26 races where the first three were all priced 17/2 or bigger provided the following average payouts:
We are back to the usual picture painted in these two articles, where the trifecta averaged more than the tricast.
Ultimately, my two takeaways from races where the first three home were all priced 17/2 or bigger are:
a) trifecta payouts fluctuate much more, and b) the bigger the tricast, the more chance the tricast has of returning more than the trifecta.
The draw seems luckier for trifecta bettors within these price parameters. I guess smaller pool sizes may play a part in this, but I have not investigated this yet, so I cannot say for certain.
Case 3 – Top three finishers priced between 5/1 to 10/1
Ideally, I wanted to use prices that I hadn’t used in the previous two ‘case’ examples, but if I had used ‘the missing’ price bracket of 6/1 to 8/1 for all the top three finishers, there would have only been four qualifying races. Hence, I have extended the price boundaries on each side to give us a more ‘middling’ group of prices compared to the first two. That gave us a decent sample of 62 races. Once again, I will start with the percentage splits for which of the two bets came out on top more often.
This price spread amongst the first three horses has again favoured the trifecta. Now to the average payouts:
The trifecta has a significant edge here regarding average payouts, averaging £171 more per race than the tricast. This equates to 44%.
I have one additional stat that hopefully will be of interest. Focusing on this subset of results, 17 of them were run at Grade 1 courses (Ascot, Doncaster, Epsom, Goodwood, Newbury, Newmarket, Sandown, York), and the trifecta paid higher in 16 of the 17 (94%). At the same time, other races saw the same payouts (to the nearest £). I appreciate that this is a small sample but a worthwhile ‘share’.
**
Summary
Both articles contain quite a lot of data to digest but I hope they have helped those of you who dabble in these exotic bets to maximise your chances of getting better long-term returns than you may have previously.
Of course, not many of us will achieve long-term financial success from these bets. The edge the bookmakers or the Tote have to begin with puts punters at a significant disadvantage. However, these findingd should assist in taking a big chunk out of their advantage if nothing else.
From a personal perspective, when I have some time, I plan to dig further into combinations of prices for the first three finishers, as I feel I have only scratched the surface. I also plan to revisit the whole trifecta/tricast area from an article-writing perspective, as I would like to examine standalone National Hunt data and possibly all-weather data, too.
-DR
https://www.geegeez.co.uk/wp-content/uploads/2024/05/276204270-scaled.jpg12802560Dave Renhamhttps://www.geegeez.co.uk/wp-content/uploads/2022/10/geegeez_banner_new_170x78.pngDave Renham2024-05-21 11:57:222024-05-21 11:57:22A Comparison of Trifecta and Tricast Payouts in Horse Racing: Part Two
In two back-to-back articles, I will examine the ‘battle’ between two exotic bets - the tricast and the trifecta, writes David Renham. These bets are incredibly difficult to win because you must correctly predict the first, second, and third horses home in a specific race. We all know that finding the winner can sometimes be a challenge, let alone the first three!
Introduction
Some punters are lured towards these bets because of the substantial potential gains if you are successful. For example, as I’m writing this piece, the Victoria Cup at Ascot has just finished, with the tricast paying £3,127.09 and the trifecta £7,636.50. I must admit I dabbled myself in this race on the trifecta and felt slightly hard done by as I had the first and second but not the third. To make it worse, the fourth and the fifth horses homes were part of my third-place combinations. I cannot complain, though, as my biggest ever winning bet came from a huge tricast payout, albeit 20 years ago.
As far as punters are concerned, the key difference between the two bets is how winnings are calculated. The tricast is a bookmaker bet, where the returns are computed and generated, giving the bookmaker a healthy margin, whereas the trifecta is a Tote pool bet. The Tote takes 25% of the trifecta pool in the UK and 30% in Ireland. Hence, as punters, you are up against it from the outset with a big overround in favour of both bookies and the Tote.
So which bet is best? Well, for this piece, I will compare handicap races with 10 to 14 runners. The data will be taken from turf flat races in the UK and Ireland during the 2023 season. This amounts to just over 1000 races (1011, to be precise), so it's a decent enough sample. For the record, I have excluded any race where there was a dead heat in one of the first three positions as the payouts get split, and it gets a bit ‘messy’. There were only six such races. I have also excluded races where there was no trifecta payout. This happens occasionally when the pool size is small, and/or the first three to finish were unfancied/decent prices.
General comparisons
Average dividend
My first port of call is to examine the average payouts for both bets in these 1000+ races. Here are the splits:
Frequency of higher dividend
As we can see, the trifecta has a much higher average payout, equating to an edge of around 26%. Digging into the numbers a little more, when the trifecta outperformed the tricast, the payout averaged out at 59% bigger; when the tricast was higher, the payout averaged 52% bigger. Let me now compare race by race in terms of which came out on top with the bigger return/payout more often:
Average dividend: UK vs Ireland
Four out of every five races saw the trifecta produce a higher return than the tricast. Regarding the ‘same’ return, I included any scenario where the returns were the same when rounded to the nearest pound.
I mentioned earlier that Irish races see a 5% extra deduction in the pool, so one would expect the UK results to outperform the Irish ones as far as the trifecta is concerned. Let’s see how this plays out in real terms, firstly looking at average trifecta payouts:
UK payouts, on average, are £153 higher, which equates to just over 24%. This is a significant difference – perhaps bigger than you may have expected, given the 5% difference in pool reduction.
Dividend Distribution
It is time to look at the payouts for the tricast and trifecta in more detail. I want to start this part by splitting the number of payouts into ten equal groups from £1 to £1000. Hence, I have totalled up the number of times the tricast paid between £1 and £100, £101 and £200, £201 and 300, and so on. Likewise, I have done the same for the trifecta. Below is a line graph showing the comparison:
The graph shows that more tricasts than trifectas were paid out when the returns were smaller (£400 or less). The reverse has happened when the payouts have been bigger than £400. Of course, this is to be expected given the average figures we saw at the beginning.
On to looking at payouts of over £1000 up to £3500 – this time, they have been grouped in batches of £250:
Regarding the payouts between £1001 and £1500, the trifecta wins hands down. It becomes more even after that but overall, the trifecta edges it slightly.
Finally, let me compare the number of payouts when the dividend paid more than £3500 – this time, it will be a straight comparison in terms of the number of times it occurred for each:
As can be seen, most of the biggest payouts came from the trifecta. However, the two biggest payouts came from the tricast - £11662 and £16900 respectively.
At this juncture, the trifecta looks the better value overall, and by some margin. However, there is plenty more digging to do and research to share.
Field size impact on dividend
What difference has the number of runners made to the payouts? Let me compare the average payouts for both tricast and trifecta for each field size:
Both graphs are generally on an upward trajectory as you would expect. Comparing the two, the trifecta edge over the tricast strengthens as the field size increases. In races of 12 to 14 runners, the trifecta has had an edge over the tricast of 25%+. This edge remains significant in 10 and 11-runner races but drops to around 14%.
Course Comparison
For the last part of this first article, I will look at how the tricast and trifecta played out in different courses. I have included courses with 15 or more qualifying races in 2023 as that gives us a decent enough sample size. First, let me compare course by course, which of the two bets came out on top more often ['Draw %' means the percentage of races where the tricast and trifecta paid the same, to the nearest pound]. Courses in red are Irish, and four courses had enough races to qualify – I have listed the courses in alphabetical order:
Of the 30 courses, 20 saw the trifecta producing the bigger payouts over 80% of the time. The top five 'trifecta performing courses’ in terms of this metric were Ayr (90.6%), Brighton (89.5%), Leicester (88.5%), Catterick (87.9%), and York (87.9%). Hence, more than nine races saw the trifecta beat the tricast at Ayr in every ten.
There were four courses where the percentage was below 70%, namely Leopardstown (69.6%), Beverley (65.8%), Ripon (65.0%), and Musselburgh (61.5%). So quite a difference between the highest, Ayr, and the lowest, Musselburgh. At this point in my research, I cannot easily find a reason for such a variance between the two; perhaps I’ll find out with more digging. The table shows the consistency of trifecta success over tricast.
The second set of course data to share are the average payouts for each. I have included a column showing the percentage difference between the averages. 28 of the 30 courses saw a higher average payout for the trifecta. The two where the tricast ‘won’ have been highlighted in bold.
The Curragh has seen the most significant differential between the two – an 82% edge for the trifecta. I thought it would be interesting to share all the results from the Curragh, including the difference between the monetary and percentage payouts. The races highlighted in red are the ones where the trifecta paid more:
This is enlightening as it does highlight the occasional randomness of the trifecta. For example, the 3:20 on 13th August saw an unusually small trifecta payout; in contrast, the payout at 4:05 on 7th October saw the reverse, with a much bigger payout than one would expect, especially given the prices of 18/1, 11/2, and 4/1. Based on my research, I estimate that this type of price configuration would pay around £550-£650.
Let me now discuss Newbury and Windsor – the two courses where the tricast ‘prevailed’. I mentioned earlier that the most significant payouts over these 1011 races were tricasts - £11662 and £16900. As you probably can guess, one of these payouts came from Newbury and the other from Windsor.
There is quite a difference between some courses in terms of the averages. This will be influenced by the market position/prices of the first three homes. To give an illustration of this, I will compare Salisbury and Ascot in terms of the average price of the horses that finished in the first three:
The prices of the first three horses will strongly influence tricast/trifecta payouts, but having some actual numbers to back it up is good. It should be noted that there is more to it than just the average prices of the first three – the market rank of the horses can be significant, too; and, in the second piece, I will delve into that in some detail.
Summary
As far as the trifecta is concerned, the size of the pool is likely to play a role. Also, the 'make-up' of the punters who have put money into the pool probably influences things. What I mean by that is, ‘What proportion of the money placed in specific trifecta bets comes from savvy/regular trifecta punters compared with those that essentially are just trying their luck?’ I am guessing that at some big meetings, especially World Pool days, you will probably get a considerable proportion of racegoers who are not regular bettors compared to bog-standard meetings. Hence, some of these will probably have a dabble on the odd trifecta due to that lure of a big win for a small outlay. This is my hypothesis, and although it is impossible to pin down actual numbers/percentages of money placed by types of racegoers, I am wondering whether further research for article two may at least offer some clues.
Anyway, it is time for me to crunch more tricast/trifecta numbers. Until the follow-up...
- DR
https://www.geegeez.co.uk/wp-content/uploads/2024/05/Bradsell_KingsStandStakes_RoyalAscot2023.jpg319830Dave Renhamhttps://www.geegeez.co.uk/wp-content/uploads/2022/10/geegeez_banner_new_170x78.pngDave Renham2024-05-14 11:44:362024-05-16 13:42:39A Comparison of Trifecta and Tricast Payouts in Horse Racing
I looked at course, distance, and course and distance National Hunt data a few months back, writes Dave Renham. I will revisit this area now but switch my attention to the flat. I will ignore all-weather racing to write about that in the future. Hence, these findings apply only to UK turf flat racing, and I have looked at the last eight full seasons from 2016 to 2023.
I mentioned last time that there is a perception that course form is necessary; likewise, some see it as a positive if the horse is proven over the distance. In the National Hunt article, previous course winners/distance winners/C&D winners won more often than horses that had not won at the course/distance/C&D. They offered slightly better value despite the market adjusting quite well. Let us see if we see a similar pattern ‘on the level’.
Course winners
I will start with course winners. As we know, courses in the UK are not uniform – the topography for each course varies. Hence, one would assume some horses act better on specific courses than others. I would like to begin by comparing the strike rates of course winners versus horses that have not won at the course (non-course winners). Both win and each way figures are shown:
Course winners clearly perform better from a win and a win-and-placed perspective.
Regarding returns to SP, course winners fare slightly better, although the difference between the two is barely 2p in the £. To Betfair SP, the roles are reversed, with non-course winners doing a little better. As we have seen in various previous scenarios, the betting market seems good at making the necessary adjustments.
Looking at the non-course winner group first, if we split them into two as follows:
1 - those who have previously run at the course
and
2 - those who have not run at the course previously,
then we see that those who have not run at the course have been slightly more successful in terms of win percentage, with an 11.3% strike rate compared to 9.9%. In terms of returns, however, they are virtually identical.
One statistic worth sharing is that horses with no course wins which have raced 15 or more times at the track in question have won just one race from 81 attempts. Such horses are rare but it looks like any future qualifier can be discounted.
Concentrating now on course winners, I would like to start by looking at horses with just one previous course win to their name.
Course Wins = 1
I will split the performances by number of runs they have had at the track. The reason behind this is simple: you could get some horses that have raced once at the course and hence are one from one, whereas you could get horses that are one from 10 or even one from 20. A horse that has just won once in 20 attempts at the same venue will not scream out as a horse that is particularly suited to the track.
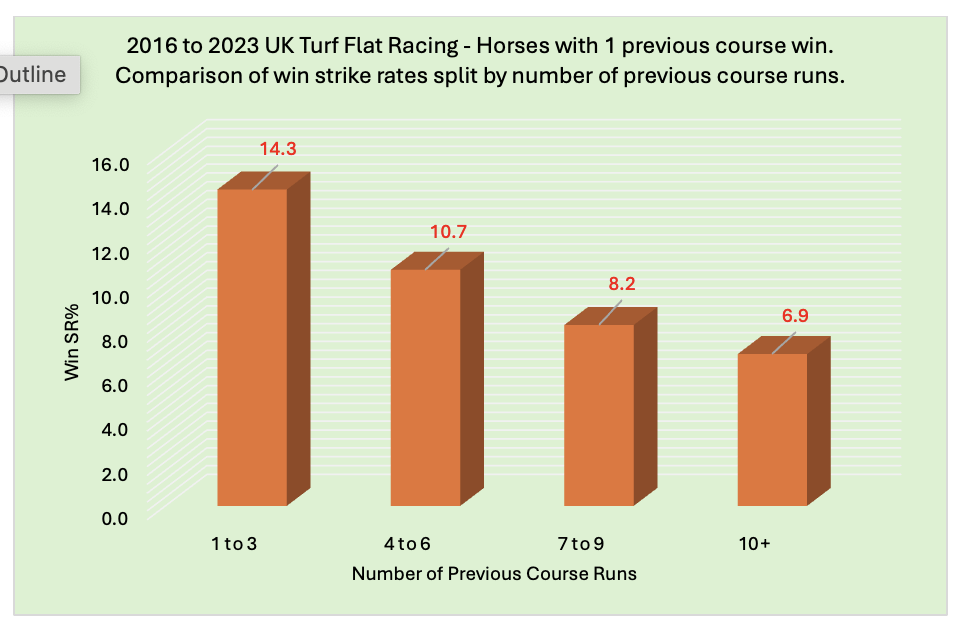
Let me share the win strike rates for different numbers of course run groupings:
The graph clearly shows that one-time course winners with fewer previous course runs win more often. Horses that have won once at the track but raced there ten or more times have scored less than once in every 14 attempts.
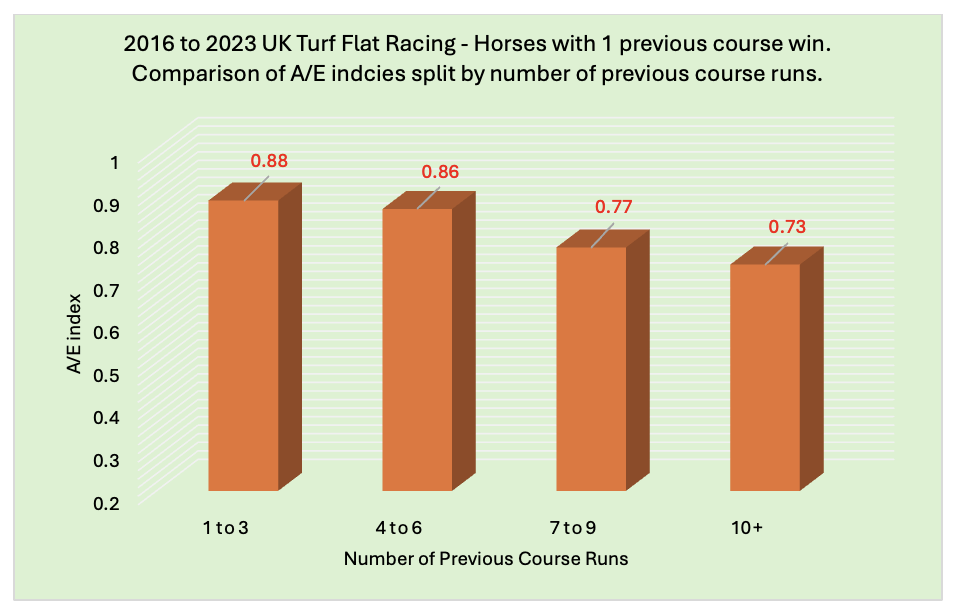
Let's see if the A/E indices correlate with these strike rates:
The graph shows a strong relationship between the A/E indices and the strike rates. Any potential value in one-time course winners tails off once we hit seven or more previous course runs.
Course Wins = 2
I will look at the same idea for horses that have won twice previously at the course. Once again, I’ll start with the win strike rates for different numbers of course run groupings:
We see the same pattern as before. It should also be noted that horses with two course wins and that had previously raced at the course either twice or thrice broke even to BSP (ROI was –0.4%).
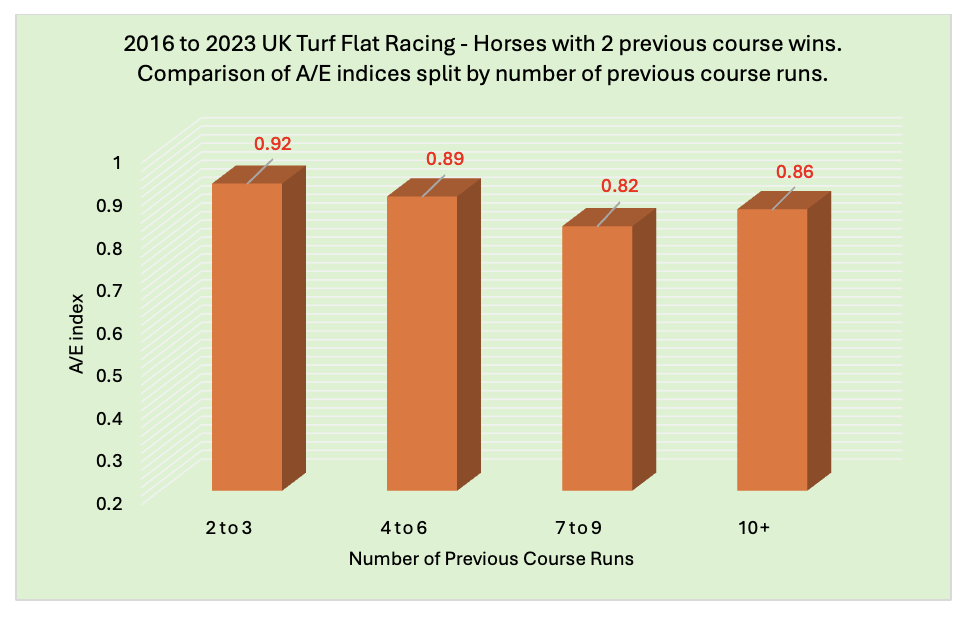
Onto the A/E indices now:
The two to three previous course run group has a very solid A/E index at 0.92. The 10+ group spoils the correlation, but if we look at the complete stats, we can clearly see that the returns to BSP indicate that the fewer previous course runs, the better.
Losses become significant once we get to seven or more previous course runs.
Course Wins = 3+
I will now lump together horses with three or more course wins to give a decent sample size. This time though, as we have different numbers of previous course wins, it makes sense to share the data using past course win percentages. Hence, a horse with three wins from 5 visits would sit at 60%, a horse with four wins from 25 would sit at 16%, and so on. This time I will go straight to a table showing all key stats in one area:
Horses with three-plus course wins and who have previously won at least two-thirds of their starts at the course - the 67-100% group - have by far the best overall figures. They have a much higher strike rate and the best A/E index and have made a small profit to BSP.
We have seen the same pattern across all data sets to date: horses with the best course win rates (based on all previous course runs) perform the best.
Before moving on to distance winners, I want to examine the results for individual courses. To do this, I will look at the A/E indices for horses that have won at least once at the relevant course. Here are the courses with the ten highest A/E indices.
Haydock and Epsom have particularly strong indices. Epsom is a unique track, and it will come as no surprise to many that it appears so high on the list. Two courses that have not made the cut, and which I expected to, are Brighton and Chester. They were joint 14th on the list with an A/E index of 0.87.
Three courses have recorded an A/E index of below 0.80: Yarmouth (0.77), Thirsk (0.75), and Carlisle (0.75). Wetherby also has a figure below 0.80, at just 0.71, but the data set is too small to be confident in at this stage.
Distance winners
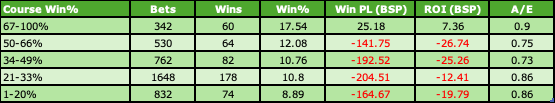
It is time to switch our attention to distance winners. As with course winners, I will start by comparing the strike rates of distance winners versus horses that have not won at a distance (non-distance winners). Both win and each way figures are shown once more:
There is a slight edge to distance winners, but they have virtually identical A/E indices at 0.87 and 0.86, respectively. When looking ‘generally,’ winning previously at a distance does not offer much of an edge in turf flat racing. However, it is always worth digging a little bit deeper.
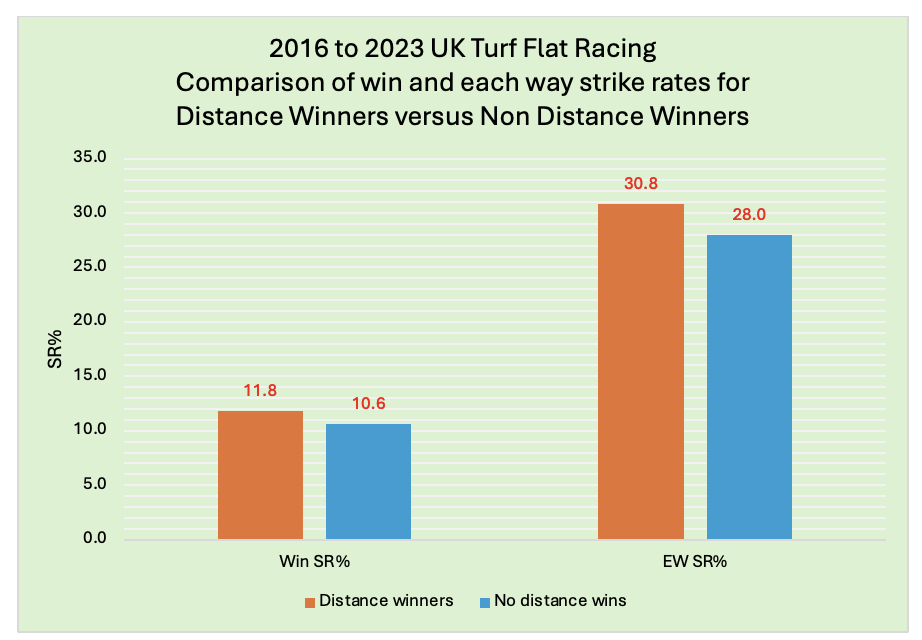
Let me compare past distance win percentages by grouping all past distance winners. Here are the findings:
Horses who have previously won at least two-thirds of their starts at a particular distance did best, and showed a very solid-looking A/E index of 0.92 with losses of just 2p in the £. This presents a similar pattern to when I combined the 3+ course win data earlier, especially when considering that top group.
Next, I decided to examine whether it makes a difference how recent the last distance win was. This is what the stats told me:
Unfortunately, this data offers little, with the only discernible general pattern being that the more recent the win, the more likely a horse is to repeat that win. That may very well be conflated with the fact that recent winners overall are more likely to win again the recent non-winners.
After further digging, I discovered the most interesting findings concerning distance winners.
1. Looking at horses aged 5+, if you restrict this cohort to having won once at a distance on their only start at that distance, they have proved profitable to follow. Hence, if backing ALL 5yos and older with one distance win from one distance start when having their second start at the relevant distance, you would have won 133 races from 862 qualifiers (SR 15.4%) for a BSP profit of £220.34 (ROI +25.6%). These runners have an A/E index of 1.01 and have been profitable for the past five years.
2. Horses with three wins from three starts at the same distance have proved profitable to follow when they have attempted to make it four distance wins out of four. They have won over 28% of the time (53 wins from 188) for a BSP profit of £62.52 (ROI +33.3%). The A/E index stands at an impressive 1.13.
3. Horses aged nine or older that have achieved two distance wins in their careers have proved to be poor investments, regardless of how many distance runs they have had. This group has provided 921 runners of which only 56 won, hitting a win percentage of just 6.1%. Backing all qualifiers to £1 level stakes would have lost you £216.64, which equates to over 23 pence in the £.
4. Two-year-olds with two or more distance wins have made a profit when attempting the distance again. They have 144 wins from 891 (SR 16.2%) for a BSP profit of £38.23 (ROI +4.3%).
Course and distance (C&D) winners
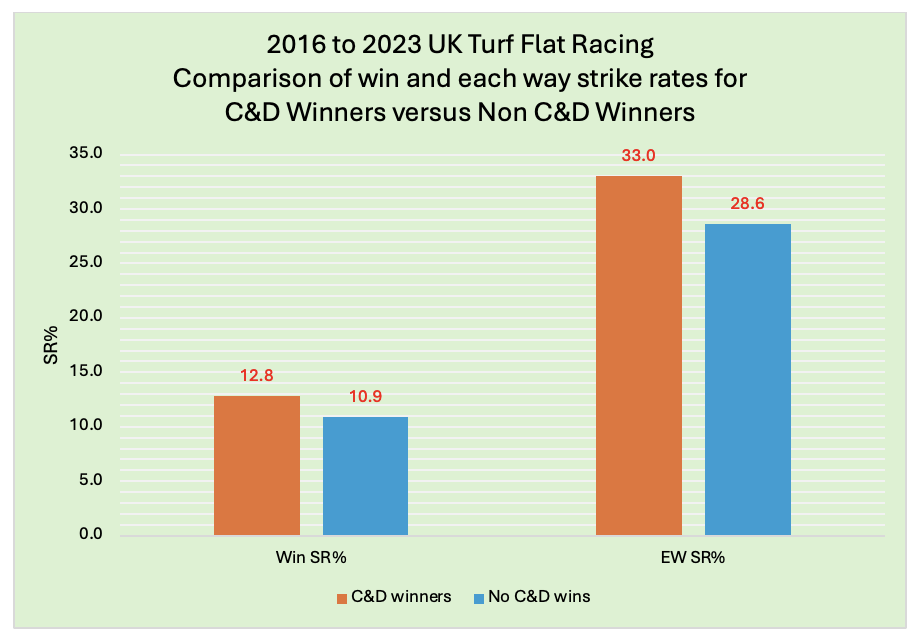
It is now time to combine the two elements. I will start by comparing the strike rates of C&D winners versus horses that have not won over C&D (non-C&D winners). Both win and each way figures are shown once more:
These are the highest win percentages we have seen for the ‘winning’ group to date, but only just. The returns to SP have been virtually identical, with a wafer-thin edge to C&D winners; but, to BSP, non-C&D winners have proved better value by nearly 6p in the £ (4% loss compared with 10% loss).
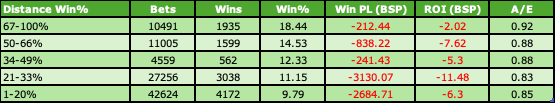
On to the win strike rates in terms of the number of C&D wins. Here are the splits:
The results for 4+ C&D winners are the reverse of the National Hunt findings. In NH races, horses that had won four or more times over course and distance scored 15.5% of the time, procuring a healthy return of over 41p in the £. On the flat, this group scored less than 10% of the time, losing over 34p in the £.
It is past C&D win percentages I want to look at next. I am using the same percentage bands/groupings as before:
We see the usual trend of the strike rates dropping as the C&D win percentages drop. Once again, the best overall stats are the group with the highest C&D Win% of 67% or more. It is possible that some value bets could be found within this group.
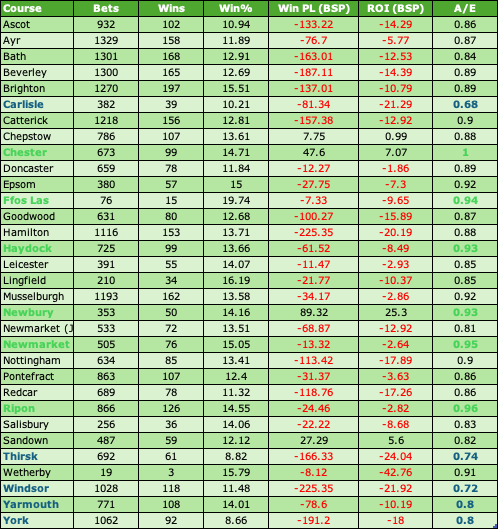
Individual course C&D data is the next port of call. Courses are listed alphabetically with ‘positive’ A/E indices (0.93 and above) shown in green and ‘negative’ indices (0.80 or lower) shown in blue. Profit/losses have been calculated to BSP less 5% commission:
Just two of the six ‘green’ courses (Chester and Newbury) managed a blind profit to BSP. Generally, though, the takeaway should be to avoid C&D winners from the courses in blue, especially Carlisle, Thirsk, Windsor, and York.
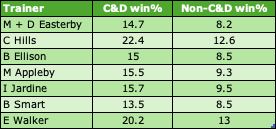
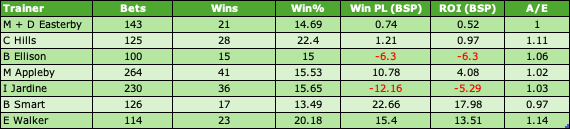
Finally, I want to share the trainers who have performed best with past C&D winners when comparing their performance to their non-C&D winners. Seven trainers are listed in the table below, comparing their win percentages for the two respective groups:
These seven all perform above the norm when it comes to past C&D winners. Five of the seven have produced blind profits to BSP with their C&D winners, with six hitting A/E indices of 1.00 or bigger. Here are the individual figures for these past C&D winners:
There are some solid statistics there. It will be interesting to see how these trainers fare in the next few years with their past C&D winners.
**
Summary
To conclude, previous course winners, distance winners and C&D winners clearly win more often than horses that have not won at the course/distance/C&D. However, evaluating the better value is more complicated. Generally, course, and course and distance, winners give better results than do distance winners.
I will leave you with what I feel are the most interesting findings:
1. For horses which have won once or twice previously at the course, stick to those horses that have raced six or fewer times at the venue.
2. With horses that have won three times or more at the course, focus on horses that have won at least two-thirds of their races (67%+).
3. Past winners returning to Haydock, Epsom or Ripon can be seen as a positive.
4. Horses that have won at least two-thirds of their races (67%+) at today's race distance are the best distance group to concentrate on (losses of only 2p in the £).
5. Avoid horses that have won four or more times over C&D. They tend to be over-bet.
6. Chester and Newbury are courses where C&D winners generally perform above the norm.
7. Be wary of past C&D winners at Carlisle, Thirsk, Windsor or York.
8. The stables of Mick and David Easterby, Charles Hills, Brian Ellison, Mick Appleby, Iain Jardine, Bryan Smart and Ed Walker have all done well with previous C&D winners.
As we move out of April and into May, the number of turf flat race meetings is increasing while the volume of all-weather meetings is diminishing, writes Dave Renham. Therefore, this is the time of year where we see the highest proportion of runners switching from an artificial surface on their last run to the turf next time out.
In this article, then, I am going to see if there are betting angles we can potentially take advantage of; either positive or negative. The study period covers flat turf races run in the UK between 2016 and 2023 where the previous run was on the all-weather. All profits/losses calculated to Betfair SP less 5% commission.
All runners switching from all-weather to turf
To start with let me share the results for ALL runners:
These runners have secured a win rate equating to close to one in ten and have an average A/E index standing at 0.85. Losses to BSP have been just over 3p in the £ which is better than the ‘norm’.
Let me now break the overall data down - firstly by market rank.
Surface switchers by Market Rank
As I am using BSP for the profit/loss column I will be analysing Betfair Market rank data. To start with let me share the A/E indices for different positions within the betting market:
As can be seen, favourites have the highest figure and the better value has come from the top four market positions. If we combine the top four in the betting the A/E index averages out to 0.89. Runners positioned 6th or lower in the market have offered relatively poor value in comparison.
Let me now share strike rates, profit/loss and returns:
The returns (ROI) have been very even with only second favourites out of line. The bigger priced runners (6th+ in the betting) have been ‘saved’ by the occasional three-figure priced winner. For the record there have been eight winners priced above 200/1 on Betfair with 880.09 being the biggest.
Surface Switchers by Finishing Position Last Time Out
I would now like to examine last time out (LTO) performance. I am using LTO finishing position and here are the stats:
Winners last time out have secured a small BSP profit, while runners-up LTO are not too far from a break-even scenario. It looks best to focus on these two groups. Horses that finished 7th or worse have edged into profit too, but again mainly due to those 200/1+ winners mentioned above.
Before moving on, let me split the LTO winner results by the all-weather course where they won:
Horses coming from four courses have seen a profit, namely Chelmsford, Dundalk, Newcastle and Wolverhampton. In contrast, last time out winners at Southwell have performed extremely poorly with a very low win rate and heavy losses of over 23 pence in the £. This has been the case over the whole-time frame so one cannot use the old fibresand surface as the reason.
Digging into this LTO course data I have found a few additional angles for LTO winners to share:
LTO winners at Newcastle that started in the top three of the betting in their next run performed well thanks to 120 wins from 437 (SR 27.5%) for a profit of £82.26 (ROI +18.8%).
LTO winners at Chelmsford that started favourite next time scored 39.7% of the time (71 wins from 179) for a profit of £29.23 (ROI +16.3%).
LTO winners at Kempton who raced next time in a handicap have gone on to win 140 races out of 772 (SR 18.1%) for a BSP profit of £92.22 (ROI +12%).
Surface Switchers by days since last run
It is time to examine days off the track to see whether that has made a difference or not:
Horses returning to the racecourse within a week have by far the best strike rate and have returned over 9p in the £. There have been big profits for the 8-to-14-day group, too, but the 880.09 winner mentioned earlier is the main reason for those. Hence, from this data I would only take a return to the track within seven days as a positive.
Surface Switchers by Sex of Horse
The sex of the horse is an area I usually examine as sometimes useful angles are uncovered. Let's see if that is the case here. Below is a graph comparing the A/E indices of male horses moving from all-weather to flat turf versus female horses doing likewise:
As the numbers indicate, female runners have provided the best value when switching from the sand to turf. This might be because females tend to underperform on artificial surfaces compared to the turf and hence, when switching back there is a better chance of showing improved form.
The best time to catch female runners seems to be during the warmer months. From June to September their A/E index rises to 0.94 and backing all runners blind (nearly 9000 of them) would have yielded a profit of £454.31 (ROI +5.1%).
Surface Switchers by Class of Race
Does the class of race make a difference? The graph below suggests for one class, it does, when we compare return on investment.
Horses switching from all-weather surfaces to the turf have produced poor returns in the highest class of contests (Class 1). However, there is even more to ‘unpack’ when we dig a bit deeper into these Class 1 results. Look at the difference the Class of race they raced in last time out made:
Horses that raced in the same class LTO (i.e. Class 1) have actually made significant profits with a strong A/E index of 0.96. Those who raced in a lower class LTO have performed extremely poorly with a below par A/E index of 0.79 and losses of more than 30p in the £. There is also quite a difference when comparing the win percentages of nearly 3%.
Surface Switchers by Trainer
The final piece of the jigsaw is to look at the performance of trainers when their horse switches to turf from a run on the all-weather LTO. Here are the trainers with the highest strike rates:
We have the usual suspects as one might expect. The record of the Charlton stable stands out with sound profits and an excellent A/E index of 1.09. If we narrow down Charlton runners to those that started in the top four of the betting when returning to turf, they have excelled. They have combined to score 56 times from 197 qualifiers (SR 28.4%) for a profit of £87.89 (ROI +44.6%). Roger Varian’s runners in contrast seemed to have struggled with losses of around 25p in the £ and a very modest looking 0.74 A/E index.
Before sharing my final thoughts, it would be useful to compare these AW to turf trainer figures with their record when their horses race on turf having raced on turf LTO. In the table below I will compare their win strike rates and A/E indices:
Individual trainer strike rates do not vary too much but the table gives us some useful pointers. Firstly, William Haggas and Roger Varian’s runners both perform much better when their horses have run on turf last time (both strike rate and A/E index). Ralph Beckett’s runners also do but the difference is less stark. Charlton’s runners perform better having switched surfaces, but their turf-to-turf runners still perform reasonably well.
Main Surface Switcher Takeaways
Before I wind this piece up, I have picked out what I think have been the strongest positives and negatives uncovered in my research.
This week there are more positives and less negatives than I was anticipating. Obviously one cannot guarantee the same patterns will be seen this year with runners switching from the all-weather to turf, but hopefully more will than won’t!
- DR
https://www.geegeez.co.uk/wp-content/uploads/2019/09/timoshenko_Goodwood_830x320.jpg320830Dave Renhamhttps://www.geegeez.co.uk/wp-content/uploads/2022/10/geegeez_banner_new_170x78.pngDave Renham2024-05-01 13:39:542024-05-01 13:39:54Switching from All Weather to the Turf
In my previous piece, I wrote about last time out handicap winners and reviewed what differences changes in their rating made when they next run, writes Dave Renham. This time, I am going to look at other handicap finishing positions (e.g. 2nd or worse).
Introduction / Overview
As with the first article I will be sticking to horses which raced in a turf handicap last time out (LTO) and which are running in a turf handicap on their next outing. Qualifying races will be flat turf races run in the UK covering 2016 to 2023 with all profits/losses calculated to Betfair SP less 5% commission.
As I mentioned previously, when any horse runs in a handicap, the official handicapper assesses their performance and will adjust their Official Rating as they see fit. So the first thing I wanted to understand this time was the percentage of ‘non-winners’ that saw their rating go up, stay the same, or go down. Here are the splits:
As can be seen, over half of the runners were dropped in the ratings, around a third stayed the same, while less than one in seven horses saw their OR raised. How did each group fared in terms of results next time? Here is what I found:
Horses that performed better LTO have won more often but the ROI% figures are within just 0.4% of each other.
I now want to focus on horses that finished 2nd LTO.
LTO finishing position 2nd
Firstly, let me look at the general stats based on whether their rating went up, went down, or stayed the same:
In terms of returns there has been a slight edge to those LTO runners up whose rating was elevated. This group has also provided the biggest number of qualifiers, whereas it is relatively rare for such runners to be dropped in the ratings.
Below is a more detailed look at runners-up that were raised in the ratings. The table shows a next time out performance breakdown by specific rating change:
Caution is advised with the profit figures for horses that have been upped by 6lb or more as these stats have been skewed by two winners priced more than 40 BSP at 40.59 and 55.51.
During the study period, over 3000 horses that were 2nd LTO were raised in the ratings by just 1lb. These runners are close to breaking even to BSP, so it is worth digging further to see if there are any interesting stats from within this group.
Class change is one area that I looked at and I would like to share the follow-up results for all LTO turf handicap runners up that were raised exactly 1lb in the ratings, in terms of the class of race change:
These stats show that LTO 2nds when upped in class have proved good value. These runners have also been profitable in five of the last six seasons. In contrast, those dropped in class have provided very poor value losing over 22p in the £ for every £1 staked.
Sticking with these LTO runners up who have been raised by exactly 1lb, let me share their results when looking at the class of race contested:
In terms of the profit and loss column we can see that the two lowest Classes (5 & 6) have both incurred losses, with Class 5 losses especially steep. In contrast, Classes 2, 3 and 4 have all proved profitable with Class 3 results very solid including an excellent A/E index of 1.02.
Finally for this group of runners (2nd LTO / up 1lb) it is worth sharing that if restricting qualifiers to sprint handicaps (5f and 6f only) they have produced a decent profit. This subset of runners won 161 times from 930 attempts (SR 17.3%) for a BSP profit of £127.02 (ROI +13.7%). The A/E index was an impressive 1.01. The even better news is that these results are not skewed by bigger priced successes. Indeed, if restricting qualifiers to the top four in the betting we get the following:
An excellent A/E of 1.04 and returns equating to over 15p for every £1 bet.
LTO finishing position 3rd
Onto horses that finished 3rd on their last start. As I did with runners-up let me start by sharing some general stats based on whether their rating went up, down, or stayed the same. Unsurprisingly, far fewer horses were raised in the ratings compared to those who finished 2nd LTO:
Again, they are a remarkably similar set of figures with no edge to any of the three groups, and the win strike rates indicate a very solid performance by the official handicapper. Let me examine the horses that went up in the ratings and look at the effect of different changes in Official Ratings:
More than half of the runners upped in the ratings went up just 1lb, but they produced losses of nearly 11 pence in the £. Those raised 3lbs made a profit but take out a BSP 70.0 winner and that becomes a loss. Likewise, the 4+ group had two big-priced winners which again made the bottom line look better than it really is. It should also be noted that all 30 runners upped 7lb or more all lost.
LTO finishing position 4th or worse
As we move into horses that did not make the first three LTO, an even greater proportion of these will end up dropping in the ratings as the pie chart below shows.
From this cohort nearly seven in ten run next time with a lower rating, with just 4% getting raised. This should not come as a surprise considering how they ran previously. The splits for each group look thus:
Horses that went up in the ratings have provided the worst returns by a few pence in the £ and, based on next time out win strike rates, it could be argued they’ve been harshly treated as a whole.
With the group going down in the ratings being such a big one I am going to look in more detail at them.
LTO finishing position 4th or worse + went down in ratings
With over 50,000 horses in this sample one would hope to find some worthwhile angles be they positive or negative. So let’s break their records down by looking at the effect of different drops in OR. Firstly, a look at next time win strike rate based OR difference from prior run:
The smaller the drop in the ratings the higher the strike rate. Let’s examine how that correlates with return on investment (ROI%):
There is sound correlation between strike rates and returns: the better value has been with horses dropped either one or two pounds and I would generally avoid horses dropped more than 4lbs.
The most interesting finding concerning horses that were dropped in the ratings having finished 4th or worse was when I looked at their market rank on the betting exchanges. Here is what I found:
Both favourites and second favourites have produced profits, each with strong A/E indices of 0.98. While returns were modest in ROI terms, considering that would have been achieved from backing all such runners ‘blind’ it can certainly be viewed as a positive. Also, this top two in the market group combined to produce six winning years out of eight, thus showing good consistency.
Those fourth in the betting have provided a decent profit, too, and although 3rd favourites did not, the top four in the betting have proved far better value than those fifth or worse in the betting.
Going back to favourites/2nd favourites here are the BSP profits and losses when splitting their results by Class of Race:
There has been promising profit from Class 3, 4 and 5 events, especially when considering market position. Class 2 qualifiers lost a tiny amount, but Class 6 favs/2nd favs have under-performed in comparison. Class 6 races are often contested by more inconsistent types, and considering we are looking at horses that finished 4th or worse LTO, albeit first or second in the betting, I am not too surprised at these poorer figures.
Main Takeaways
Before closing, I have picked out what I think are the strongest positives and negatives uncovered in this research into the impact of ratings changes on beaten horses in turf handicaps.
There are a few areas of interest arising for me so it has been a worthwhile continuation from the last article. In the future I hope to revisit Official Rating Change with one potential idea being comparing their current OR rating with their highest winning rating.
Until next time…
DR
https://www.geegeez.co.uk/wp-content/uploads/2019/09/CallumRodriguez830x320.jpg320830Dave Renhamhttps://www.geegeez.co.uk/wp-content/uploads/2022/10/geegeez_banner_new_170x78.pngDave Renham2024-04-24 08:05:242024-04-24 08:05:24Handicap Losers and Official Rating Change: A Study
As the title suggests, in this article I examine last time out (LTO) handicap winners and look to see what impact, if any, different changes to their rating makes when they race again, writes Dave Renham. I will also be grouping together all LTO winners upped in the ratings to explore general trends and stats.
Introduction
When any horse runs in a handicap, the Official Handicapper assesses the performance and decides whether the Official Rating – a number that determines in which class a horse should run and how much weight it should carry – should go up, down or stay the same.
These ratings are adjusted and published every Tuesday so there will be times when a handicap winner runs again before it gets reassessed. When this occurs, the horse in question must carry a fixed penalty of extra weight in order to meet its rivals on somewhat fairer terms. This is 6lb for a 2yo or 3yo, 5lb for a 4-6yo, and 4lb for a 7yo+.
Hence a seven-year-old horse that won off a handicap mark of 76 LTO will carry a 4lb fixed penalty if running prior to reassessment and will race off a handicap mark of 80 in that race (76+4).
When a horse wins a handicap, the Official Handicapper needs to decide by how much to raise its rating. If it wins narrowly, it is likely the rise will be small; but if the horse wins comfortably by several lengths, then the rise is likely to be more significant. This is why some jockeys ease their mounts up near the finish in an attempt to narrow the winning margin in hope of a smaller rating rise. Ratings points equate to 1lb in terms of weight carried.
Now, when horses switch from turf flat to all-weather or vice versa there are potential issues such as when a horse is far better on one surface than the other. In these circumstances the handicapper has the option of allotting a ‘split’ handicap rating, different for each surface. In this article I am avoiding that scenario by sticking to horses which won a turf handicap LTO and who are running in a turf handicap on their next start. I have concentrated on turf flat races run in the UK covering a time span from 2016 to 2023. All profits/losses have been calculated to Betfair SP less 5% commission.
Official Rating (OR) Change – All turf winners
To begin with let me share data for all LTO turf winners and the effect of different changes in Official Ratings:
As the table indicates from the number of runners in each row, the rise tends to be between 3 and 6 pounds. Generally, the more a horse has been raised the more it increases its chances of winning. However, this does not equate to profit! Looking at ROI% figures one could argue the better value in terms of horses going up in the ratings are with those raised between one and two pounds.
A handful of horses saw their Official Rating decrease. There are a few reasons why this might happen. It could be due to a big race having early declarations and they win just before that race takes place. It could also be due to a horse being off the track for a long time. For example, Soldier in Action won a handicap at Goodwood in September 2018 off a mark of 94 but was not seen again on the track for four years. He raced off 90 on his return as the handicapper has the discretion to drop a rating in these circumstances, when in possession of a lot more information about the value of the previous race-winning form. These runners have made a profit from a very small sample.
For the remainder of the article, I am going ignore the two small groups of LTO winners that either stayed the same rating or indeed raced from a lower rating, meaning that I will be focusing only on runners whose Official Rating increased.
Rise in Official Ratings by Race Class
I would like to split the results of handicap winners raised at least 1lb or more by Race Class. Does this make any difference? Firstly, I looked at win strike rates:
It is interesting to see the increase in win percentage as the level of race gets easier. However, we know strike rates are not instructive from a ledger perspective so we need to examine returns. Also, Class 2 handicaps do tend to have bigger fields so one would expect the win SR% for that group to be lower.
Unsurprisingly, all race classes made a loss, and the splits are shown in the graph below:
There is not much in it when comparing the returns of Classes 2 through to 5. However, Class 6 LTO handicap winners have got close to breaking even (loss of just over 2p in the £) and they seem to have offered the best value during the period of study. If you had concentrated on Class 6 qualifiers that won a Class 6 handicap LTO then these runners would have lost less than 1p in the £.
Sticking with LTO handicap winners racing at Class 6 level, it is very interesting when we split the results by how much the horse was raised. I have grouped them together in batches to give bigger sample sizes:
The table suggests that the less a horse has gone up in the weights the better from a value perspective. It should be noted that the results for Class 6 runners upped between 1 and 3 pounds have+ not been skewed by huge-priced winners. Indeed, when these runners started favourite, they returned over 14p in the £ thanks to 72 winners from 228 qualifiers (SR 31.6%) for a BSP profit of £32.37. Second favourites were also profitable though only just.
So we see that, in Class 6 handicaps, horses upped by eight pounds or more have proved very poor value albeit from a small sample. But what about horses upped by eight pounds-plus in other Class grades? Here are the stats:
As you can see Class 3 runners have snuck into profit. However, Class 5 runners have struggled losing nearly 25p in the £. Hence horses raised 8lb or more have struggled in the two lowest classes (5 and 6) – they look worth swerving.
Rise in Official Ratings by Age
A look now at whether the age of a horse makes a difference when trying to repeat a handicap win having been upped in the weights/ratings. I want to look at win strike rate first as there is a pattern:
As the graph indicates, in terms of win percentage horses aged two to five outperform those six and older. Once we get to 9yos and older the win rate drops below 10%. Let me share now the Betfair return on investment figures to see if they correlate with the strike rates:
There is good correlation between the ROI% and the win strike rates. 7yos buck the trend slightly but the graph otherwise trends in the right direction. 9yos+ have been very poor value losing nearly 28p in the £. 2yos have proved the best value although would still have lost a shade under 4p in the £ for every £1 staked.
As 3yos provide the biggest group of LTO turf handicap winners by some margin, let me drill into their record in more detail. If we narrow our 3yos down to those who were raised just one or two pounds we get the following results – 72 winners from 410 (SR 17.6%) for a BSP profit of £102.08 (ROI +24.9%). Each of the last four years has produced a profit to BSP.
Remarkably the biggest hike in the weights/ratings for a LTO winning 3yo has been a massive 23lbs! It should be noted that when the rise gets beyond 10lbs, 3yos have been less successful. Under these circumstances they have managed to win just 17 of 117 races (SR 14.5%) for a loss of £31.44 (ROI -26.9%)
I have one last age-related stat to share: horses aged nine or older when raised just 1-2lbs have won only twice from 50 attempts (SR 4%). Betting all qualifiers would have lost a massive 76p in the £. 43 of these 50 runners had won LTO by less than a length so my guess is that they had nothing ‘in hand’ when winning and hence going into their next race it made a repeat win very difficult.
Rise in Official Ratings by Sex
Do male horses or female horses perform better when raised in the weights after a turf handicap win? Here are the splits:
Female runners have outperformed their male counterparts across the board, delivering a higher strike rate, better returns, and a higher A/E index. This is interesting because when we look at all flat runners, males tend to win slightly more often than females.
It makes sense to look at this female group in more detail. Firstly, let me examine their stats by Class of race:
In the ‘run of the mill’ handicaps of Class 4 and 5, female runners have performed far less well. However, at either end of the scale, Classes 2 to 3, and Class 6, their record has been very solid. At the basement level of Class 6 they have made a good profit and with the highest priced success being 22.58 BSP, these figures have not been skewed by a random 50/1+ winner or two.
Another stat worth sharing is that female qualifiers who were raised just 1 or 2 pounds would have been worth following thanks to 70 winners from 423 (SR 16.6%) for a BSP profit of £54.35 (ROI +12.9%).
Sticking with these LTO female winners, they seem to have a favoured time of the year. Below are the A/E indices split between two time frames – March to June and July to November.
Runners racing in July to November have proved far better value than those seen earlier in the season. The ROI percentages correlate with these figures as female runners from March to June would have lost you over 16p in the £, females racing between July to November have essentially broken even. There is a theory about fillies and mares enjoying the sun on their backs and, while that may or may not be true, the data appear to support it.
Before moving on there are three more female stats worth sharing:
As we can see, LTO turf handicap winners raised in the weights who were female have proved profitable in a variety of situations.
Rise in Official Ratings – Comparison with Class LTO
When a horse wins a handicap and goes up in the ratings there will be times when they will be rated too high for the class of race that they contested last time. Hence there will be far more horses stepping up in class than dropping in class. Obviously, there will be some that will contest the same class as last time. Let us look at the overall figures for all LTO turf handicaps winners that went up 1lb or more in the ratings:
Horses dropped in class have won more often than those upped in class but they have been poor value, losing around 19p in the £. Horses remaining in the same class have offered the best returns/value, but they still produced losses of around 7p in the £.
Drilling down in class change + rating change there is one positive I have found. Horses that were raised in class but upped just 1 or 2lbs have made positive returns. The 509 qualifiers have provided profits of £97.69 (ROI +19.2%) thanks to 73 winners. The overall A/E index is a solid 0.94, and results have been consistent over the last four years as all four have turned a profit.
Conclusions / Main Takeaways
Ratings change in handicap winners is not an area that I have investigated in much detail in the past, but it has highlighted a few interesting stats well worth noting through the season.
Below I have picked out what I think are the strongest positives and negatives to keep in mind.
Good luck.
- DR
https://www.geegeez.co.uk/wp-content/uploads/2024/04/273951142-scaled.jpg12802560Dave Renhamhttps://www.geegeez.co.uk/wp-content/uploads/2022/10/geegeez_banner_new_170x78.pngDave Renham2024-04-09 09:40:082024-04-09 09:40:08Handicap Winners and Official Rating Change: A Study
Despite the turf flat slowly beginning to click into gear, I am going to dip my toe back into the world of National Hunt racing for one final time this season, writes Dave Renham. With the Aintree and Punchestown festivals to come there is plenty of great jumps racing still to look forward to.
In this article I will look at the performance of horses on their very next start having had their last race at the Cheltenham Festival. What should be looking for? Is a win at the festival a positive for the next run? How do Cheltenham Festival runners fare at Aintree? What about if they return to the racetrack at the Punchestown Festival? These questions and more will be examined in what follows. Let's dive in.
The data have been taken from 2015 to 2024 and profits / losses calculated to Betfair Starting Price less 5% commission.
[ex-toc]
What impact does Cheltenham Festival finishing position have on next start?
The first port of call is where the horse finished last time out (LTO) at the Cheltenham Festival. Here are the splits:
Fallers look to be a group of runners to ignore next time: their one in eight win rate came at a cost of over 38p lost for every pound invested. Likewise, those who finished 11th or worse but completed the course had an identical strike rate and similarly eye-watering (-33%) ROI.
In terms of positives, winners at the Cheltenhm Festival have an excellent record on their next start, doubling up just shy of 40% of the time. As a group, they have also returned a steady profit of better than 18p in the pound. Not only that, but they have a positive A/E index of 1.05 implying sustainable profit. If we look at the yearly figures for Cheltenham Festival winners, we see the following in terms of profit / loss:
Seven of the nine years have turned a profit, albeit a small one in some cases; and the two losing years were far from disastrous. It looks as though Cheltenham Festival winners require very close scrutiny on their next start.
Somewhat surprisingly given the success of LTO winners, horses that finished second at Cheltenham have performed quite poorly when considering the profit/loss column, losing over 33p in the £ and with a low A/E index of 0.74. These runners look to be significantly over-bet and well worth a swerve.
Which Courses have been best for LTO Cheltenham Festival runners?
Next, I wanted to investigate which courses fared best when Festival runners visited on their follow-up run...
Three courses recorded a profit – Ascot, Cheltenham and Punchestown. However, the Cheltenham bottom line is completely skewed by Premier Magic who was successful in the 2023 Hunter Chase at the huge BSP of 110.14 having been pulled up in the same contest a year earlier.
Next time out at Fairyhouse
At the other end of scale, horses that have headed to Fairyhouse have performed poorly from a decent sample size. Indeed, at the Fairyhouse Easter Festival from last weekend, 23 Cheltenham Festival runners showed up but only one won - Jade De Grugy at odds of 7/4. The 22 beaten included Ferns Lock at 2/7 and Zarak The Brave at 5/6 as well as six other horses at 9/2 or shorter.
It may be worth noting that only 7% of Cheltenham Festival runners make their next start at Fairyhouse.
Next time out at Punchestown
The vast majority of next time out Punchestown runners (roughly 90% of the qualifiers) did run at the Punchestown Festival which is held at the end of April / beginning of May. There are two stats worth noting in terms of these Punchestown runners:
Horses that won LTO at the Cheltenham Festival have an excellent record when turning out at Punchestown next time: there were 34 winners from 75 runners (SR 45.3%) in the sample period for a BSP profit of £40.97 (ROI +54.62).
Clear favourites have also turned a profit at the Irish track thanks to a 50.8% strike rate (63 wins from 124) amounting to a small profit of £13.64 (ROI +11%).
Not many horses head to Ascot on their next outing after the Cheltenham Festival but they tend to run well. There have been six winning years out of nine and with no winners returned above 20/1 the stats have not been enhanced by big priced scorers. Clear favourites have done well from a limited sample winning 9 from 16 (SR 56.3%) for a BSP profit of 12.34 (ROI +77.1%).
Next time out at Aintree
Focusing in now on Aintree, of the 927 runners that ran at the Liverpool track next time 867 of these ran at the showpiece Grand National meeting. 92 of these won (SR 10.6%) for a BSP loss of £55.45 (ROI -6.4%).
If we focus solely on horses that started in the top three of the Aintree betting, we can sneak into profit to BSP. This subset of runners won 67 of their 306 starts (SR 21.9%) for a profit of £13.41 (ROI +4.4%).
Cheltenham Festival winners have also done a good job of backing up that win when turning out next time at Aintree with 18 winners from 62 (SR 29%) for a profit to Betfair SP of £12.54, just over 20p in the £ ROI.
In terms of negative stats, it looks best to swerve horses that were either beaten by 30+ lengths at Cheltenham and those who failed to complete the course. These runners when coming to the Aintree Festival have combined to win just 14 races from 233 runs (SR 6%) with heavy losses of £105.81 (ROI -45.4%)
Race type – handicap v non-handicap
There is a significant difference in terms of performance between horses that contest a handicap after the Cheltenham Festival as opposed to a non-handicap. If we compare the A/E indices of each group we see a marked differential:
Horses that run in a non-handicap after the Cheltenham showpiece have been far better value than those who went on to contest handicaps. If we look at the BSP returns, we can see that the figures correlate strongly with the A/E indices:
As can be seen, horses that ran in a handicap next time lost over 20p in the £, whereas non-handicappers lost less than 4p. In fact, if we stick to horses that raced in a handicap at the Cheltenham Festival and then contested another handicap next time, the record is even worse:
These results make for very poor reading. I wonder if it is because most of the horses would have been trained with Cheltenham as their main target. Whatever the reason, I would not be keen on backing handicappers from the Cheltenham Festival when contesting another handicap next time. I should add that one of the handicap winners was priced 94.51 BSP so taking that one out means the other 1326 runners would have lost you over 32 pence per £1 staked, even more distressing than the 25% losses with that brief respite included!
Days since Cheltenham Festival run
Let's now consider the time between a horse's Cheltenham Festival run and its next appearance. Here are the splits:
A very small proportion of runners are seen again quickly (within two weeks) and this group has made a profit from a one in four strike rate. A good proportion of the 43-to-70 days group ran at the Punchestown Festival which perhaps explains the strike rate, the small losses and decent A/E index. The 181-to-270 group has the most interesting results for me. We are roughly talking about a break of between six and nine months which essentially takes us to the start of the following National Hunt season. These runners have just about broken even to BSP, with a near to one in four win rate and a very solid A/E index. Horses that started clear favourite after this 181-to-270-day break have performed well thanks to 125 wins from 235 (SR 53.2%) for a BSP profit of £24.24 (ROI +10.3%).
Market factors for LTO Cheltenham Festival runners on their next start
The next area I wish to look at is the price of the runners on their next start after the Cheltenham festival. I am look at the Betfair SP price and the table below looks at the key stats:
Although the 2.02 to 3 group have incurred relatively big losses, it generally has been preferable to stick to horses BSP priced under 9. Horses priced 21 or more have offered poor value and incurred significant losses of over 28p for every £1 staked.
If we compare the A/E indices between horses priced 9 or lower with those 9.2 or higher, we see a big difference:
To get the best value, horses priced 9 or shorter are the ones to concentrate on. Also, given the non-handicap data I shared earlier, it should come as no surprise that if sticking to this shorter price range in non-handicaps the record improves further. This subset of runners has edged into profit thanks to 443 wins from 1275 runners (SR 34.8%). The profit stands at £19.15 (ROI 1.5%).
Class Move Next Time after Running at Cheltenham Festival
Before finishing the main body of the article I have a couple of additional stats to share based on the race class difference between the Cheltenham Festival run and next start – they are both negative:
UK-trained horses going up in class on their next start have struck less than once every 18 starts for an enormous 43% loss, while those trained anywhere stepping up to Grade 1 level from a lower class run at the Cheltenham Festival were similarly catastrophic to follow in terms of both strike rate and ROI. Horses from these groups should generally be avoided!
Summary – Key Takeaways
Below are the key findings from this article.
It's a pity publication has followed the (early this year) Fairyhouse Easter Festival [apologies, my fault - Ed.] as that was predictably disastrous for Cheltenham Festival follow-up runners. But, with Aintree and Punchestown still ahead, as well as the start of the next season, there's plenty to heed, and hopefully profit from, to come.
- DR
https://www.geegeez.co.uk/wp-content/uploads/2024/03/Absurde_CountyHurdle.png319830Dave Renhamhttps://www.geegeez.co.uk/wp-content/uploads/2022/10/geegeez_banner_new_170x78.pngDave Renham2024-04-02 10:21:442024-04-02 11:35:15What Happens on Next Run After The Cheltenham Festival?
Over the past week I have finished collating thousands of stats, and crunching most of them, in order to be primed and ready for the new turf flat season, writes Dave Renham.
The first things I always update in the close season are draw statistics for each course and distance. If possible, I want to stay ahead of the crowd by noticing whether biases seem to be strengthening, weakening, or potential new biases are emerging. When analysing draw bias, I tend to focus on handicaps only with at least eight runners (generally the more runners the better). A good chunk of the data shared in this piece will be from 8+ runner handicaps only.
While draw bias may not have the overall impact it had twenty to thirty years ago, there are still enough edges in play to give shrewd punters a leg up. However, it is crucial to fully understand how strong any biases are and whether the market has compensated, or in some cases over-compensated. It has been two years since I last looked at draw bias on Geegeez so let’s crack on and review a selection of my recent findings and their potential ramifications.
Ascot 5f to 1 mile (straight course)
The straight track at Ascot is one I keep a close eye on, not just year on year, but meeting by meeting, day by day. Draw biases seem to come and go at the Berkshire track and it is not always easy to predict how strong they will be and which part of the track, if any, will be favoured. Biases are most likely to occur in big field handicaps where the runners tend to split into two or sometimes three groups.
At the Royal Meeting in 2023 there were six straight course handicaps where the field sizes ranged from 26 to 30 runners. The first such contest of the week, the Royal Hunt Cup, produced the following result. The first ten finishers are shown:
Although the winner Jimi Hendrix was drawn in single figures the next six finishers were drawn in the 20s and eight of the top ten were drawn between 20 and 30. This race suggested that higher draws held a decent edge over middle / low draws. Now, just because one race displays a draw bias like this, we cannot be certain that this will be replicated in subsequent races during the same meeting. However, last year, by the end of the Thursday punters should have been fairly confident that there was a playable high draw bias, as the Buckingham Palace handicap that ended proceedings on the third day of the Royal meeting delivered the first five horses home from stalls 24, 23, 12, 21 and 22.
Indeed, this high draw bias was repeated in all three of the big field handicaps that took place on the Friday and the Saturday. For example, the first six in the Sandringham were drawn 25, 16, 18, 24, 20 and 29, while in the Palace of Holyroodhouse the first six finishers were drawn 25, 16, 17, 20, 27 and 29.
I mentioned earlier that draw biases at Ascot are not always replicated in subsequent races. This comes from watching and punting on many past Royal meetings. There have been times where the draw bias seems to have flip-flopped from race to race. Why this happens is not always clear. It could be that what appears to be a draw bias might in fact be down to a pace-based bias. As punters we need to make an informed judgement whenever we see what appears to be a draw bias at a specific meeting, to decide whether it actually is one or not.
The Royal Meeting, though, does provide the best opportunity to profit from draw bias at Ascot. Essentially, for me there are three ways I tend to play the draw at Royal Ascot on the straight course:
Split the stalls into three and focus solely on that part of the draw from which I think there will be an advantage. If I am right, then by eliminating two-thirds of the runners, my chances of profiting increase considerably. I can take this view before any big field handicaps have taken place or I can wait for one or two to give me a steer.
Wait for the first race or two and if one or both races have shown a strong bias, take the contrarian view and focus on what looks to be the unfavoured side. Bookmakers will be aware of the previous races and are likely to shorten up the expected ‘favoured’ side and push out prices of those drawn on the presumed unfavoured side. If the bias flip-flops, as mentioned earlier that it can do, then we have secured have excellent value. This is a risk-reward approach.
Back horses on either flank – one high, one low. Or if the field is in the mid-20s or higher I often play two either side. Alternatively, I go one high, one low, one middle. This is a hedging approach and I probably use this method the most taking the view I have more options covered and can still get value prices backing three or four runners due to the big field sizes.
Certainly 2023 was high draw friendly at Ascot on the straight course. If we look at all handicaps across the year with 14 or more runners we see the following draw splits:
As can be seen, high draws dominated the win strike rate, the P/L bottom line, PRB, A/E indices and Impact Values.
Will high draws dominate in 2024? Only time will tell. However, with big fields we should be able to get some value prices especially if the draw turns out to be in our favour.
Brighton 1 mile
Two years ago, when I wrote a series of articles on the draw, I mentioned the 1-mile Brighton bias in the third article. At the time, I had not previously been aware of this bias. In that piece the draw data from 2016 to 2021 suggested that high draws held an edge with low draws being at a disadvantage. Looking at the 2023 figures for handicaps with 8+ runners we see the following:
Obviously, the sample size of eight races is tiny, but the PRB figures are especially potent in terms of suggesting a bias still exists. Indeed, combining last year’s results with 2022 we get a bigger sample and the same pattern:
So, in the two years since sharing the high draw bias with Geegeez readers, we can see nothing appears to have changed. In fact, one could argue the bias looks slightly more pronounced. There are two additional findings I would like to share. Firstly, horses drawn 11 and higher have a PRB figure of 0.65 over this 2-year period. Secondly, if you had permed the highest three draws in combination forecasts you would have secured an 18.63-point profit.
Catterick 5f
About 15 to 20 years ago Catterick offered draw punters two biases – a low draw bias on good or firmer, and a high draw bias on soft or heavy. These days, for whatever reason, the low draw bias on firmer ground does not seem to exist. However, when the going gets soft, higher draws still have an edge. This is because the ground is better the wider you go in the straight. There have only been seven qualifying races in the past two seasons, but the figures strongly favour high draws as the table below shows:
Five of the seven races have been won by high draws, with good correlation across the A/E indices, Impact Values and the PRB figures. A good example of how strong the bias has been under these conditions can be seen by looking at the result of the Millbury Hill Country Store Handicap which took place on October 25th 2022:
As you can see the first three home were drawn in the top three stalls, the first five home were drawn in the top five stalls, the top seven home came from the top seven stalls, and those who finished in the final five spots from 8th to 12th came from the lowest five stalls.
Going further back in time to give us a bigger sample (2016 to 2023), we see the following:
These figures indicate that soft ground bias at Catterick over 5f gives punters a playable bias to work with. Indeed, you could have backed the highest three draws ‘blind’ over these 28 races and secured a profit to SP of £27.00 (ROI +32.1%); to BSP it would have been £43.44 (ROI +51.7%).
Before moving on, let us look at a smoothed-out graph of stall positions based on PRB figures from soft/heavy 5f handicaps from 2016-2023 using the Geegeez metric PRB3:
This gives us excellent correlation with all the other stats for this C&D on soft/heavy clearly showing the bias.
Goodwood 7f
Goodwood was the first course I ever visited in terms of going racing and I fell in love with it then and still love it to this day. I have been there more times than all other racecourses combined. Back in the 1990s I made huge profits in 7f handicaps as horses closest to the inside rail enjoyed a massive edge. Course officials eventually cottoned on to the bias around 2005/2006 and they have managed to even the playing field to some extent since then. However, low to middle draws still tend to hold sway with very highest draws finding it difficult to win. If we look at the last two years the 8+ runner handicap splits are as follows:
During this time frame middle draws have edged it in terms of wins and have secured decent profits. Low draws have performed well in terms of places, and they comfortably have the highest PRB figure. Now some people looking at these stats will acknowledge that higher draws seem at a disadvantage, but they may dismiss it as a course where the draw bias is not potent enough to be of interest. However, I would like to compare the performance of horses drawn 1 to 6 with those drawn 7 or higher:
This data seems to demonstrate there has been a strong draw bias at work in the past two seasons. It also demonstrates that as punters it is worth analysing data in different ways to build the most accurate picture we can. This is especially true when we are looking at small to medium sized samples.
Before moving on here are the basic draw splits for Goodwood 7f handicaps (8+ runners) since 2016:
This longer-term data set shows that the bias is something that we do need to consider. The value lies with lower draws as they have provided roughly 50% of all winners (from 33.3% of the total runners) although one still needs to find the right horse(s) as they are not profitable to follow blindly.
Gowran Park 7f
Over to Ireland now and the 7f trip at Gowran Park. This course and distance was highlighted in the same draw series of two years ago showing a decent low draw bias especially on good or firmer going. Since then we have had 15 more qualifying races similarly quick turf with the following draw third splits:
Those are strong figures, backing up the data shared previously. To save you having to scroll through past articles here are the 2016-2021 stats I shared then.
Again, we can see excellent correlation between both tables: not only have low draws enjoyed a strong edge, but higher draws have had a very poor time of it. In fact, combining all horses that were drawn 9 or higher in the past eight seasons under these conditions would have seen just six wins from 260 runners! Losses of 71p in the £ to SP just underlines the difficulty these higher draws have.
For fans of perming lower draws in forecasts, you would have made hay in 2023 thanks to one race. The first division of the Coast to Curragh Charity Cycle Handicap on 16th August 2023 saw The Fog Horn (drawn 1) win with Kodihill (drawn 2) coming second. A £1 reverse forecast on these two lowest draws would have yielded a monumental return of £976.71; the reverse exacta would have paid even more at an eye-watering £1674.50 return for a £2 stake.
Gowran Park is a course where I will be looking for draw-based opportunities in 2024.
Pontefract 1 mile
This mile trip at Pontefract has offered a strong low draw bias for many years now. Over the past two seasons there have 28 handicaps with 8+ runners, of which half of them (14) were won by one of the three lowest stalls. Here are the draw results for all stalls during this time frame:
These results clearly show the strength of the bias – just look at the PRB figures and the placed percentages for the lowest draws. If we include stall 4 with the bottom three stalls, we get the following splits in terms of placed percentages:
That is getting close to three times the number of placed runners from the inside four stalls. In terms of PRB figures the difference is equally significant:
My strategy over this track and trip has long been to focus on the lowest draws. I have tended to concentrate on stalls 5 or lower, with the lower the better. The good news from a punting perspective is that the market has still not adjusted fully and there remains some value to had with these lower draws.
*
I hope this article has shown you that draw bias is still alive and well albeit at a handful of course and distances. This is not an exhaustive list but hopefully there has been enough here to give you some useful and profitable pointers for the season ahead.
- DR
https://www.geegeez.co.uk/wp-content/uploads/2021/06/Oxted_KingsStand_RoyalAscot2021.jpg319830Dave Renhamhttps://www.geegeez.co.uk/wp-content/uploads/2022/10/geegeez_banner_new_170x78.pngDave Renham2024-03-25 16:37:512024-04-02 14:44:44Top Draw Biases for the 2024 Flat Season
Spring is upon us, and the turf flat kicks off this weekend, writes Dave Renham. It is my favourite time of the year as all of my winter research can be unleashed in an attempt to hammer the bookies! Of course, despite all the hard work put in it, it does not guarantee profits for the year ahead. No doubt it will be the usual rollercoaster of good weeks, bad weeks, and indifferent ones. Hopefully, though, there will be more good than bad!
In this article I am going to investigate recent trainer form to see what I can unearth. Newspapers, betting sites and some pundits seem to place a lot of stock in trainer form; I must admit that I tend not to, but I am prepared to change my mind depending on what I discover: have I been missing a trick all these years? Let’s see.
I have taken flat and all-weather data from 2021 to 2023 for UK racing and profits/losses have been calculated to Betfair Starting Price less 5% commission (readers can do better than those results by selecting the 2% commission option in your Betfair account).
My focus is going to be on 14-day trainer form, but with a caveat. The caveat is that a trainer must have had at least 20 runners during that time frame. I’m adding this to make sure we eliminate small samples which are unreliable.
To try and explain how small samples can be unreliable, a trainer could theoretically have had five runners in a 14-day period with one win and four losers giving them a recent win strike rate of 20%. Generally, a strike rate of 20% for trainers at any time is considered very good. However, firstly that 20% strike rate is based on very limited data. Secondly, let us imagine all five runners had been odds-on favourite – that would not be crying out good trainer form. To be clear, I’m not suggesting that 20 runners in a 14-day period is the perfect number of runs, but it seems as sensible an arbitrary figure as any.
General 'Recent Form' Trainer Statistics
Time to review the first set of data. Here, I am looking at trainer strike rates – both win and each way linking with the win percentage individual trainers had achieved in the previous 14 days.
This initial piece of evidence suggests, at least from a strike rate angle, that trainers who had been in better form over the past 14 days outperform those whose recent form had been less good. Both the orange line (Win SR%) and the blue one (EW SR%) show solid correlation with the graph, on an upward trajectory.
However, as a recent article of mine suggested, strike rates are not the be all and end all; we need to look at value and profit / loss. The table below gives us a breakdown of this:
This presents a less clear picture but, looking at the returns, the trainers who have scored 5% or less with their last 20+ runners over the most recent two-week period have provided the worst returns. Looking at the trainers with the highest recent strike rate (31% or more), it appears that the betting market has compensated for this to a great extent given losses of more than 13p in the £.
Of course, the data shared so far looks at all trainers combined. This gives us a general starting point, but to get a better overall perspective we need to split the trainers into groups. This is because comparing the 14-day win strike rate of Charlie Appleby, say, with Liam Bailey makes little sense. Appleby has a 29.6% strike rate during the time frame compared to Bailey’s 4.3%. In addition, Appleby’s A/E index of 0.94 is nearly double that of Bailey whose figure stands at 0.48. Hence in a scenario when Appleby and Bailey have secured a 15%-win strike rate in the past 14 days, we should be aware that Bailey is performing well above his norm and Appleby well below. Looking at all trainer data therefore gives us a flavour but cannot paint the full picture.
To mitigate somewhat for this, I am going to consider split trainers into groups based on their annual win rate while analysing recent form (14-day results).
I have split them into five groups: those with an annual strike rate of 8% or less, those between 9% and 12%, 13% to 16%, 17% to 20%, and finally trainers winning at a rate of 21% or more.
Trainers with a yearly win strike rate of 8% or less
Looking at all trainers who had run at least 200 runners from 2021 to 2023, around a fifth of them had an overall win strike rate of 8% or less. With this group I would not expect to see many qualifiers in the higher 14-day strike rate groupings.
The biggest group of qualifiers has occurred in the 6-10% 14-day strike rate (SR%) bracket and they have made a BSP profit. However, this is down to two unusually big-priced winners of 451.93 and 350.0 which skew the figures considerably. What is clear is that once trainers in this group hit 16% or more with 20+ runners in a 14-day period they do start to have better results. Combining the results of the 16%+ group they have returned 10p in the £ with a solid A/E index of 0.93 from a sample of around 400 runners.
Trainers with a yearly win strike rate of between 9% and 12%
This group of trainers is the biggest and includes runners from the stables of Richard Hannon, Richard Fahey, David O’Meara, Kevin Ryan, and Jim Goldie to name but five. Let us look at the overall win and each way strike rate first:
The graph shows that this group of trainers have performed quite poorly in terms of win strike rate if their 14-day Win SR% had been between 21 and 30%, which is surprising. I expected the orange and blue lines to rise gradually and relatively smoothly from left to right.
When we compare the A/E indices we see a similar pattern:
Combining the runners from the 21-25% group and the 26-30% group would have lost over 16p in the £ to BSP. Even the 31%+ group lost 15p in the £ despite a decent A/E index. It seems that the market is aware when these types of trainers are showing good recent form and prices have been more than adjusted to account for it. Here is a tabular view of this group:
The 0% group has performed better than expected. However, as we will see, this turns out to be an outlier when considering the rest of the research I share.
Trainers with a yearly win strike rate of between 13% and 16%
This group of trainers includes Charlie Johnston, Archie Watson, and Clive Cox. Here are their stats:
There are better strike rates across each grouping as we would expect from higher general strike rate trainers, but these handlers look worth avoiding if they have had no winners from 20+ runners in the past 14 days. Losses of over 26p in the £ is steep albeir on a smaller sample size.
The picture is not much brighter at the other end of the scale – trainers that seem to be in flying form with a 14-day SR% of 31% or more have made losses of over 14p in the £. Their strike rate is relatively poor, too, at 15.09% and their A/E index a modest 0.86. These are the two key discoveries from what is essentially another mixed bag of findings.
Trainers with a yearly win strike rate of between 17% and 20%
Let’s see if this smaller group of trainers can give us some stronger patterns. Ralph Beckett and Sir Michael Stoute are two trainers who are included here in the following results:
When these trainers are out of form (14-day SR% of 5% or less) they look worth avoiding. Combining the top two rows of data we see significant losses of 27p in the £. Conversely, when they hit the dizzy heights of 31% winners or better in the past 14 days this cohort has edged into profit. I would guess that it will come as less of a surprise for such trainers to hit these levels from time to time and perhaps the market has failed to properly adjust.
Overall, these stats are strong with a decent strike rate of close to one in four, returns of over 7p in the £ and an excellent A/E index of 1.04. In general, these stats correlate better with what I would have expected to see.
Trainers with a yearly win strike rate of 21% or more
We are now looking at a very select band of trainers including Charlie Appleby and Willie Haggas. Here are their win strike rates based on recent form:
I want to focus on win percentages (hence no EW ones on this graph) to help illustrate how little difference there is in some of the numbers. For example, when this group of trainers had previously had a 6-10% win SR% over the past 14 days their win rate was 19.8%. When it was 21-25% in the previous 14 days their win rate was virtually the same at 19.9%. Let me share the fuller picture:
The first thing to point out is that a 14-day SR% of 5% or less is extremely rare in this collective, as one would expect. Secondly, I want to highlight the poor performance of the 31%+ group which incurred losses of over 18p in the £ and produced a disappointing A/E index of just 0.83.
There is no easy explanation as to why the 26-30% group have fared so well in comparison. My reading of the data is that when these yards seem a little under par (previous 14-day SR% of 11 to 20%) their runners may offer a little bit of value. I guess punters could be put off by the relatively modest recent strike rate, but essentially these runners are still scoring close to each trainer’s norm.
At this juncture the picture is quite muddy when it comes to 14-day trainer form. The strongest and most important finding is that we can say that a 14-day win SR% percentage of 5% or less is a negative.
*
Individual 'Recent Form' Trainer Statistics
It is time now to look at individual trainers. With each trainer plying their trade in a different way, one would hope there might be more insights to glean here. Fifty of the leading trainers are shown in the table below in terms of their win strike rate (missing cells are due to limited data):
Before going into more detail let me share their A/E indices with you as well. I have colour coded the A/E indices with positive figures of 1.00 or more in green and negative ones of 0.70 or less in red.
Individual Trainer Angles to Note
These are what I think are the most significant findings:
Andrew Balding does unexpectedly well when his recent 14-day SR% is less than 5% returning 37p in the £ on all runners. He also made a BSP profit with his 6-10% group.
Ralph Beckett looks a stable to follow when he hits the 14-day win SR% of 26% or more. An A/E index of 1.05 and a small profit to boot.
The Crisford stable has a bizarre set of strike rates and A/E indices:
Both metrics correlate with each other which gives us confidence in the findings, but the data is suggesting that the poorer the recent form of the stable the better.
Don’t be put off by low recent 14-day win strike rates for Eve Johnson Houghton. When her strike rate was 5% or less in the previous two weeks her runners have offered good value. Backing all runners blind in this context would have secured a small profit.
When Alan King’s 14-day SR% has been between 21% and 25% he has managed just one winner from 62 runners. Losses of 90p in the £ would have been recorded backing horses from a so called ‘hot’ stable.
Daniel Mark Loughnane has the type of profile I was expecting more of. When his 14-day SR% is 5% or less his record is very poor. When it hits 26% or more his record has been excellent. He does a look a clear case of “avoid when his stable is cold, take advantage when the stable is hot”.
When the Kevin Ryan stable is out of form, his runners are probably worth swerving, especially if he has failed to record a winner from 20+ runners in the previous 14 days.
Saeed Bin Suroor’s A/E indices for the four groupings in which he has enough data are all above 0.90 suggesting his stable perform in a similar vein regardless of very recent form.
Grant Tuer shows a similar pattern to Crisford implying that the poorer the recent form of the stable the better from a betting perspective.
*
Summary
So, what are the main takeaways from this research? When looking at the general picture, I think the data indicate that poor 14-day form has more of an effect on performance than good 14-day form. ‘Cold’ stables with 14-day win rates of 5% or less from 20+ runners are best avoided (with a few individual exceptions).
In terms of when a stable has been ‘hot’ over the past 14 days we see an uptick in win rate, but this does not guarantee value or profitability due to such form being fully exposed in the market.
Regarding when a ‘hot’ trainer should potentially be followed I would use the individual trainer table of A/E indices looking for figures close to, or greater than, 1.00.
I plan to revisit this idea in the future, looking at a slightly longer prior time frame to see what difference, if any, that makes. I could also delve into NH trainer stats as well. But that’s for another day. I hope you have enjoyed this piece, and good luck with your early flat season betting.
DR
https://www.geegeez.co.uk/wp-content/uploads/2023/10/WoodhayWonder_Newmarket.jpg319830Dave Renhamhttps://www.geegeez.co.uk/wp-content/uploads/2022/10/geegeez_banner_new_170x78.pngDave Renham2024-03-20 09:42:362024-03-20 09:42:36Is Recent Trainer Form Important?
I am guessing that around 70% of the people reading this bet on horses on a regular basis, writes Dave Renham. By ‘regular basis’, I mean either daily or weekly. Regardless of how many bets you may have in a day, week, month, year or lifetime, the aim for the majority is probably to be profitable. Plenty do it just for fun and if they make a few quid from time to time that’s a bonus. And the smart ones combine those two reasons: profit, and fun.
For me I put myself mainly in the first category. There are two reasons for this, firstly a sense of arrogance, I guess; wanting to prove myself and outwit / outcompete the bookies. Secondly, I like having more money. Simple as that!
Introduction
To achieve the goal of long-term profits we all follow a slightly different path, not just in terms of how many bets we average a week / year but in how we go about the process. I think time is one of the biggest factors for many. It certainly is for me – gone are the days when I was able to spend all day, every day solely devoted to betting. I did that for roughly six years straight when I was running a tipping service from 2001 to 2007. I was in my mid-thirties when these 12-hour days dedicated to horse racing and betting was the norm. Nowadays, the thought of a 12-hour shift just makes me feel tired! Not only that, but I also cannot devote that sort of time to it even if I wanted to. Alongside my life in racing, I teach private online Maths lessons, have family commitments, etc, etc.
As it stands, at this point of my life, I would guess that on average there are probably three or four days in the week where I can give some time and thought to betting. That may be 4-5 hours on any given day, that may be as little as an hour. Hence, I have had to adapt my betting methods from those I employed between 2001 to 2007. Back then I focused on 5f to 6f sprint handicaps, as well as the occasional 7f contest. I would analyse every single qualifying race in significant depth. Some races would offer up bets, some would not. Spending a few hours on one race is fine if you can pinpoint a value selection – not so much fun when you can’t!
Fast forward around 20 years, and my pathway to finding bets is somewhat different. In the rest of this article, I’ll share some of my approach…
I wonder how many readers keep a list of horses to follow. That is something I have always done, but now I am far more reliant on it than I was back in the day. In fact, it has become the first thing I look at on the days when I have time to analyse some races. If I have a horse to follow declared to run, then my first port of call will be to look at the race in which it is running and assess its chance. If I have no daily qualifiers from my list, I will head to my ‘comfort blanket’ of shorter distance handicaps, looking primarily for any race where there is potentially a run style bias, a draw bias, or ideally both.
Going back to my horses to follow list I am going to share what types of things I look for in terms of how a horse can make it on to my list.
Horses that run well against a pace bias (Negative pace bias)
This type of idea is something I discussed in a two-parter for Geegeez back in November 2020. Here’s part one, and here is part two. In the article I picked ten races which seemed to show a pace bias and looked at the subsequent performance of horses that had ostensibly run well against the bias. The research for those two articles inspired me do much more digging. After writing those pieces I spent a few months fine tuning what I will call my negative pace bias method, and by April 2021 I was using it to highlight horses to follow for my personal betting.
In terms of determining a race which has the potential to throw up pace bias qualifiers that could make my horse to follow list, I use just two methods, both of which rely on a basic criterion or starting point. I want to share one of these ideas with you and my ‘in’ in terms of looking for this group of qualifiers is as follows:
Race distance of 5f to 7f
Race must be handicap with at least 10 runners
The first three finishers must have either been given pace abbreviations of L or P, or first three must have been given pace abbreviations of M or H.
On the third point, this stipulation allows me to explore two pace scenarios. Firstly, when there is bias to more prominent racers; and secondly an off the pace bias when mid-pack or hold up horses fill out the first three placings.
This initial starting point means I can trawl through recent results to find some qualifying races. It does not mean I will find a horse to follow in every race that passes my basic criterion. However, permit me to walk you through one example that did. It was a 7f 10-runner handicap at Southwell from January last year. Here are the first seven finishers with comments in running, run style (RS) abbreviations and sectionals:
As you can see, the first three home raced close to or up with the pace (see 'RS' (run style) column - L, P, P) as indeed did the fourth placed finisher. Another thing to note is that in terms of positions given from the running lines (the set of five bold font numbers - in-race position - and superscript - distance behind the leader/ahead), all four of these runners maintained a position in the top four throughout.
A further key fact staring us in the face thanks to the sectional data was that the first part of the race was slow (note the blue colours in the left hand side 'blobs' and especially in the first race blob above the result. Generally, if the early pace is slow in a shorter race, then those positioned near the front have an even greater advantage than usual. It means that in these early stages they are not exerting themselves too much and thus they can be expected to have more in the tank at the business end of the race. This makes it harder for horses in midfield or at the back early in the race to pass them late on. That certainly seems to have been the case here and the final telling sign is that, according to the sectional blobs, the final two furlongs were run FAST or VERY FAST compared with par, suggesting there was indeed plenty in the tank for those horses that had raced prominently.
All the pointers in this race suggest that the first four home were strongly favoured by how the race was run in terms of pace. Titan Rock, on the other hand, which finished fifth, was not favoured by how the race was run. He was held up early in 8th, maintained a similar position for much of the race before finishing fastest of all in the last two furlongs. Not only that, he ‘took keen hold’ early which would have expended some additional energy. He finished best of the midfield/held up runners and was a horse that I felt had run well against a pace bias. Another positive was that, priced 22/1, he had also outrun his odds. He was a horse that I put on my horses to follow list.
Zip, who finished 6th, and Witch Hunter, 7th, were also of interest as both were settled off the pace early; and Titan Rock only beat Zip by a nose, who in turn was only a neck in front of Witch Hunter at the line. Zip had been favourite, so I downgraded his run a little as he was unable to make up any ground in the final furlong or two. Witch Hunter was of more interest than Zip because he, like Titan Rock, had been keen early, but had also been forced to switch left two furlongs out losing him some vital time. Hence Witch Hunter made my list as well as Titan Rock with Zip missing out.
Now we are all familiar with the phrase Sod’s Law... well, Zip won on his very next start at the juicy price of 11/1. So, I potentially had missed out on a big priced winner having failed to put him on the list. In better news I backed Titan Rock on his next two starts, which are shown below along with that original Southwell run:
A win at 13/2 arrived two runs after Southwell - when racing closer to the pace – that did help ease the pain of missing out on Zip’s win! Witch Hunter on the other hand was less of a success from a personal perspective. Here are his next seven runs and once again I’ve included the original Southwell result at the bottom:
As you can see Witch Hunter did eventually get his head in front at the huge price of 50/1 (7 runs and 5 months after Southwell), but I had removed him from my list by then. I ended up backing him on his next four runs, hitting the post twice at 5/2 and 14/1. I kept him on the list despite a poor 20th out of 22 showing at Doncaster. This is because he had never raced on heavy ground and was trying a mile for the first time. In hindsight, maybe I should have skipped this race and waited for the next one.
There is no fixed number of races a horse will stay on my list. Having said that, it is rare that I retain one for more than three or four runs. Likewise, I will not back every horse to follow that is declared to run. I will put my money down if I perceive the horse to offer me value.
In many respects it would be much easier if I had a hard and fast rule that stated, for instance, that any horse on my list to follow should be backed three times and then removed from the list. However, for me, that becomes more systematic which is not how I operate. That might be an idea for some – it would certainly save time and help with discipline; but I still like individual race analysis and trusting my judgement.
I could offer many more examples of horses that have ended up on my list via the pace bias route – some winning soon afterwards, others not. As with any approach it is not bombproof. The decision about the races you pick and the horses you list are personal to you. That's part of the fun!
I have been using this method for nearly three years now and it is one I will be continuing to use in the coming months and years, which probably tells you that I think it is a worthwhile one!
Horses that run well against a draw bias (Negative draw bias)
Negative draw bias attempts to highlight a horse or horses that ran well from a poor draw and hence in theory have run better than their finishing position may have initially indicated. Essentially, this is using the same premise as I did with horses that had run well against a pace bias.
I discussed the general theory of negative draw bias before back in May 2022 and, despite writing about it there, I think it is important to emphasise that this idea continues to produce future winners on a regular basis. Now, draw bias per se is not as potent as it once was and much, if not all, of the value has gone in terms of backing well drawn horses. However negative draw bias is alive and continues to kick and I want to keep it firmly in the minds of readers as you can definitely profit from this. Allow me to share with you how I pick what makes it to my horses to follow list.
There are two ways a horse could be flagged up on negative draw bias. Firstly, horses which run well from a known poor draw, for example a horse drawn 10 at Chester over 5f finishing within a length or two of the winner. And secondly, a race where the numbers seem to indicate one side of the draw was strongly favoured. This primarily occurs on straight courses with big fields (circa 15+), usually when such races see the field split into two or more groups.
Let's look at the first one – horses that run well from a 'known' poor draw. The criterion for 'poor draw' varies from course to course and distance to distance. For example, at some track/trip combinations a horse drawn 10 or higher is drawn poorly, at others a horse drawn 7 or higher is drawn poorly. I use a small but select band of course and distance pairings, namely:
As with the pace bias races, I tend to stick to handicaps and in general the bigger the field size the better. In terms of distance beaten or finishing position for potential list qualifiers, it depends on the individual race and my perception of the strength of the bias.
The second approach takes longer to establish potential list qualifiers as I need to examine every big field handicap to see if one part of the draw has seemingly been strongly favoured. Below is a race where I found three horses that made it to my horse to follow list:
This was a Chester sprint over five and a half furlongs, so low draws tend to be well favoured. The first horse that caught my attention, then, was Evocative Spark who had started from stall 8. Chester sprints I always re-watch a few times on video, and I watched this race back at least five times viewing different horses. I don’t always check the race video regarding potential list making horses but track position at Chester can be crucial due to its very tight nature.
Horses drawn 8 or wider at Chester over 5½f have a PRB figure of around 0.41, so the 8 post for Evocative Spark in this field of eleven was a poor one. Also, the horse finished really well having been short of room – he was the fastest horse in the final furlong (note his 1-0 split of 12.26s). This was a definite for my list. Likewise, Count D’Orsay, who finished a neck behind Evocative Spark in 5th was drawn even worse in 10 (DR says 12 but stalls 9 and 10 were non-runners). Not only that but he raced wide losing important ground on such a tight track. He also finished very well (3rd fastest horse in final furlong clocking 12.41s) and he too made my list.
There were two other horses I considered, the first of which was Dare To Hope. Draws 1 to 4 are by far the best draws here so the 7 box for Dare To Hope I still classed as a negative. He ran better than his finishing position of 7th suggested, but not quite well enough to make my list. The other horse I considered was the winner Call Me Ginger. It is rare that I will consider a winner as a potential horse to make my list but, having watched the race a few times, I realised that Call Me Ginger was value for more than his winning margin. Starting from stall 6 he ended up racing three wide most of the way before being shuffled about seven horses wide on the final turn. He ran much further than ideal so I reckoned that if he hadn’t been wide for so long, he would have won by two or three lengths rather than a short head. Hence, Call Me Ginger was the third horse to make my list from this race.
So, what happened in subsequent races? I’ll start with the horse that didn’t make my list, Dare To Hope. Next time out, having been dropped 2lbs in the weights, he finished second at 17/2, before winning two starts later at 14/1. This is a bit of déjà vu – first Zip and now Dare To Hope!
Meanwhile, Evocative Spark came out next time and won easily.
However, before readers pat me on the back, I did not back the horse as I was put off by his draw in 9. A wide draw over 7f is not as bad as over 5½f but it was enough to put me off. The words ‘missed’ and ‘boat’ spring to mind once more.
In happier news, Call Me Ginger was back racing seven days later at Ascot and I did back him: he won at 11/2.
Count D’Orsay came second in his next two starts, both of which carried my money. I backed him one more time, but he finished 8th and was taken off the list.
*
Let's now switch to big field handicaps where a draw bias has seemingly occurred, and there were three similar examples at Royal Ascot last year: two on Friday and one on Saturday. The first race indicating a strong draw bias was the Sandringham with the first ten horses home as follows:
The draw seemed to play a huge role in the outcome of this race with the first seven home drawn 25, 16, 18, 24, 20, 29 and 19. High to middle draws totally dominated the finish and the first seven all raced on the stands’ side (near side). Magical Sunset (drawn 5) and Lady Alara (drawn 3) were the first two home from the low draws on the unfavoured far side. This race screamed out that both these horses had run far better than their finishing position suggested. Hence both were added to my list of horses to follow.
Later that day in the 5f Palace Of Holyrood Handicap the same pattern emerged with high to middle draws dominating the race. The first eight finishers were drawn 25, 16, 17, 20, 27, 29, 13 and 23. Harry Brown (drawn 7) finished 9th, best of the low draws and far side group. The second horse home on the far side was The Big Board who finished 11th. Of the two, Harry Brown made my list but as The Big Board finished a further 2¼ lengths behind Harry Brown I decided not to add him.
The next day the Wokingham Handicap replicated the middle to high draw pattern making 5th placed Fresh (drawn 4) and 9th placed Kings Lynn (drawn 2) potential horses for the list. These were the only single figure drawn runners to finish in the first 17 horses over the line! Fresh was two lengths behind the winner and Kings Lynn a further length back. Both had done enough in my opinion to be followed.
In hindsight perhaps I should have reconsidered adding The Big Board to the list given that these races, which had been so close to each other, had both shown such a strong and consistent bias. However, I didn’t, and you guessed it, déjà vu reared its head again. The Big Board won its next two starts at 4/1 and wait for it... 22/1.
Of the five listed horses I backed Fresh three times before taking him off the list after a best effort of 5th of 17. Kings Lynn finished 6th next time, not beaten far, but after finishing well down the field in the Stewards Cup (22nd of 27) he was removed, too. Harry Brown I backed twice with disappointing finishes of 8th and 10th before binning him. Lady Alara also won two races later at 25/1, but I had scrubbed her from the list after a poor run at Sandown. Ouch! Magical Sunset proved more fruitful: she finished 7th next time but was beaten less than two lengths. I kept her on the list which proved a very good decision as she won next time at 18/1.
Using negative draw bias to pinpoint horses to follow is a method I have used for over 25 years. So, a lot longer than I have used my negative pace bias methods. Back in the late 1990s and early 2000s I felt these horses would offer value in subsequent races, and I still believe that now. As with negative pace bias such horses won’t always win for you, and sometimes you will drop horses from your list that a run or two later make you feel a fool by winning. I have also shown examples above of horses that I considered but did not ultimately appear on my list and who went on to win soon afterwards. Moreover, I have shared times when I have not backed a horse from the list only for it to win. This is part and parcel of betting I’m afraid – those ‘if only’ moments, those ‘déjà vu’ moments. You win some, you lose some.
Maybe, after all, I should experiment on paper at least, backing all negative pace and draw qualifiers on their next three starts and see how the outcome would differ. Can I be a 'system' man after all?!
Race Watching / Race Replays
While discussing the Chester sprint earlier, I mentioned I re-watched the race several times. Reviewing past races is something I have done for years, but I wish I had done more of it especially going back in time. In terms of negative pace or draw bias races, I tend to watch back all the potential negative pace bias races, but not all the draw biased ones. I tend to skip re-watching big field straight course handicaps which look draw biased – over the years I have found that using the draw positions and the comments are good enough, plus the fact many of these races I do watch live.
Although I bet far more on the flat, I do also bet on National Hunt racing, primarily in chases. National Hunt chases are the races I watch back more than any other race type, including flat races. My focus is generally on novice chases, and I try to steer clear of the bigger meetings or more high-profile young chasers. One time of the year when I watch a lot of NH racing is in the summer. Evening jumps meets are more accessible for me in terms of being able to watch racing live, so I find that a useful avenue when searching for horses to add to my list.
I want to use an example of a horse I noted back in the summer of 2017, namely Adrrastos. I saw him win at Worcester in a novice handicap chase on 18th July of that year. What impressed me was his jumping – he was fluent, jumped straight and when push came to shove his athleticism seemed to stand up well to pressure. That was his chase debut and, looking back on his hurdling career, he had won once and been placed a further five times in seven starts. His two bumper races also saw him pick up a pair of places. Hence, for the level he was at, he had been consistent over the smaller obstacles / on the level which I took as a positive. I also liked the fact that he led from start to finish. As readers of my articles will know I like front runners in chases. Another positive was that his trainer, Jamie Snowden, was faring better with his chasers than his hurdlers at the time (Chase A/E index was 0.88; hurdle one was 0.65).
Adrrastos had done enough for me to make my horses to follow list. I backed him next time in a four-runner chase at Stratford. He won comfortably by ten lengths (SP 7/4) leading from start to finish and jumping cleanly bar a slight nod on landing at the final fence.
Now, chasers can stay on my list for several races, especially young improvers, and Adrrastos as a five-year-old was in that category. His next run saw him upped in class into to a £13,000 handicap chase back at Worcester and it was his first time outside novice company racing against more experienced chasers. I decided to swerve this race from a betting perspective. I thought his price was a little tight (SP 7/2) given the class rise.
As it turned out I made the right decision. He was taken on for the lead this time and raced mainly in second. Coming to the last there were five horses within a couple of lengths. He showed a good attitude to finish close up in third, beaten 2¾ lengths. That effort was plenty good enough to keep him on my list but I did notice a couple of times he was jumping slightly to the right. Not badly, but enough for me to make a note. This was a left-handed track and horses that jump out to the right consistently are at a disadvantage especially if the jumps are on a bend. I was hoping therefore to see him race right-handed soon as this jumping trait would not potentially be an issue.
He headed to Plumpton next and was back in novice company and back down in class (£6,000 race). These were big positives for me; the only negative was being upped in trip from two miles to 2½ miles. I was not sure this increase in distance was what he needed. However, after looking at the race in detail I decided if I could get 8.0 or bigger on Betfair then that would represent value, and I managed to nick 11.0 just before the ‘off’. Adrrastos led but made his first serious jumping error in four starts and was pulled up soon afterwards, just before the second last. To be fair, despite leading at the time, I am not convinced that he would have gone on to win without the error. I think it was the extra distance that was his undoing.
The question now was should I keep him on my list? My answer was yes, but with caveats. I was now looking for very specific conditions for this horse. Back to two miles, ideally on a right-handed track, ideally likely to front run, and below Class 2 company.
Adrrastos did not reappear on the racecourse for 502 days! I had pretty much forgotten about him until his name was flagged up again. In this race, three of the four conditions were met – track was Hereford which was right-handed, it was over two miles and it was a Class 3 event. One downside was when I looked at the pace tab on Geegeez:
In the LR/2LR/3LR/4LR (last run, 2nd last run, etc) columns, 4 means 'led'. It didn’t look like Adrrastos would have it all his own way in front. Dicosimo was another genuine front runner while Envole Toi had also front run in his previous three races. Hence three of the four conditions had been met, the other was iffy.
The other potential downside was this huge break. I assumed though that if the trainer was running him again, he was ready to go; whether he would be fit enough was another matter. I looked at his trainer’s record with horses coming back from a long break – with chasers it was not too bad although to get a decent sample I looked at breaks of six months or more.
As with any potential bet from my horse list, I had to decide whether the price available offered me value. Taking all things into account I felt he should be priced somewhere around the 10/1 to 14/1 mark. 20s was available on Betfair and so I felt that represented a viable bet.
Dicosimo won the battle for the lead with Adrrastos racing in second, but Adrrastos jumped well and was still in contention three out and travelling nicely. He took the lead at this point and never surrendered it. The ideal outcome! Adrrastos stayed on my list for a further six months in which time he ran on eight further occasions. Of those eight, I backed him in four, winning once at Kempton (right-handed track where he led from start to finish), and coming 4th, 3rd and 3rd in the other three. It is rare for me to keep a horse on my list for so long, but there will be occasions when it makes sense to do so. I felt this was one such horse.
I have given you one detailed example of how I have deployed watching race replays in the past. This is one of many examples I could have chosen. Not all have gone as well as this of course, but I specifically chose that one because I wanted you to appreciate that horses can stay on the list for more than a few races. If, that is, there is good reason!
Watching past races is not for everyone but I find it very useful. Yes, I will spot things that 99% of others will, but there will be occasions when I spot something that most do not – I just have to make sure these ‘spots’ are insightful ones!
Sectional Timing
This is a relatively new area for me. Sectional timings are now a part of my pace and draw research at the courses we can get them. Clearly, sectional timing is linked inextricably to pace bias. I used some of the sectional data in the Southwell race discussed earlier in the negative pace bias section. I also used it when looking at the Chester draw race. The beauty of sectionals is it gives us more numbers to play with, as opposed to just race comments, pace abbreviations, etc.
In the last 12-18 months I have been experimenting with a variety of sectional timing ideas that I hope have the potential to find horses for my 'to follow' list. I am still learning what might work and what definitely doesn’t, but it is a fun process as it is something I have not looked at in depth before. I am not quite at the stage yet when I can confidently say a specific sectional timing idea is likely to be profitable, so no horses have been added to my list to this point. However, let me share an example of one of the ideas I’ve had that may have potential.
So, I have been looking at big field handicaps and specifically at well fancied runners (favourites / strong second favourites) that were well beaten, with the idea of trying to use sectional timing to find reasons for their poor run. If the reasons are compelling enough, then perhaps these horses could be worth following. Each of these race studies/analyses of sectionals will be slightly different depending on exactly how the race panned out and how the favourite ran.
Here is an example race from Ascot last year (I have excluded the in-running comments to get a big enough screenshot). The first ten finishers home are below:
The favourite, Perotto, finished 10th, so on the face of it a disappointing run. However, if we look carefully, out of the top ten finishers, nine of them were positioned in the back half of the field early (after two furlongs) - note the first bold number, representing race position, and the superscript denoting distance behind the leader. Perotto is the only one of the those that was positioned in the top ten early, 3 lengths off the lead (103).
The first part of the race (S-6, start to six furlongs out) - see the blobs above the result grid - was FAST compared with par, the last part (1-0, the final furlong) Q SLOW (quite slow), so everything was pointing to a pace collapse, or at least a notable deceleration, late in the race. If we focus on Perotto’s path through the race, he was challenging for the lead two furlongs out (3hd) having been five lengths off the lead at the 4-furlong pole (135). Maybe this effort was not his optimum strategy, and from there he started to drop away again.
At this point I wanted to dig further by using some of the numbers the sectionals gave us. Because the horses that were placed in the top ten positions early all finished 10th or worse, I thought it would be a good idea to compare the final furlong splits of these ten horses. I have highlighted the times (red squares) and positions/lengths behind leader (blue squares) in the screenshots below:
Perotto’s final furlong time of 13.94s was over half a second quicker than any of the horses that had raced in front of him early. The next fastest, Ghaly, was clocked at 14.53 (0.59 seconds slower). My assumption therefore was that, considering the early pace, Perotto did well to finish that quickly.
Taking all the sectional evidence into account, I feel that Perotto’s run was better than it looked. Now I’ve stated earlier that no horse has yet made my list by sectional ideas such as this one. My thinking is still not fully formed as I have intimated. I suppose I could argue that this race could be considered a negative pace bias race, which technically it was, but it did not meet my criteria to qualify on pace bias grounds. It would have done if it was over 7f as opposed to a mile.
On this occasion, it would have been a sound decision to list the horse as Perotto has raced three times since and won twice, at 5/1 and 10/3.
I am hopeful that in the next few months I will be confident enough with at least one of my sectional timing ideas to begin putting it into practice.
Those of you interested in sectional timing should really check out the data on the Geegeez site and Matt’s excellent content which can be found from the Articles tab at the top of any page and scroll down to the Sectional Timing area – there are 17 articles dedicated to it.
**
This has been a long article and it's time to wind things up. I do have other ways horses qualify for my to follow list, but that will have to wait for another time.
Please share any ideas for horses to follow lists in the comments below – it would be great to hear your thoughts.
- DR
https://www.geegeez.co.uk/wp-content/uploads/2019/09/timoshenko_Goodwood_830x320.jpg320830Dave Renhamhttps://www.geegeez.co.uk/wp-content/uploads/2022/10/geegeez_banner_new_170x78.pngDave Renham2024-02-27 11:13:062024-03-01 09:36:26How to Compose a ‘Horses to Follow’ List
geegeez.co.uk uses cookies to improve your experience. We assume that's OK, but you may opt-out from the settings. Cookie settingsACCEPT
Privacy & Cookies Policy
Privacy Overview
This website uses cookies to improve your experience while you navigate through the website. Out of these cookies, the cookies that are categorized as necessary are stored on your browser as they are essential for the working of basic functionalities of the website. We also use third-party cookies that help us analyze and understand how you use this website. These cookies will be stored in your browser only with your consent. You also have the option to opt-out of these cookies. But opting out of some of these cookies may have an effect on your browsing experience.
Necessary cookies are absolutely essential for the website to function properly. This category only includes cookies that ensures basic functionalities and security features of the website. These cookies do not store any personal information.
Any cookies that may not be particularly necessary for the website to function and is used specifically to collect user personal data via analytics, ads, other embedded contents are termed as non-necessary cookies. It is mandatory to procure user consent prior to running these cookies on your website.