
The lockdown is easing and racing will resume in Scotland from this week. Time for a trip north, then, to analyse the draw and pace data from Ayr racecourse, writes Dave Renham. As with previous articles in this series I have used some of the tools available on the Geegeez website, specifically the Draw Analyser, the Pace Analyser and the Query Tool. The main period of study goes back to 2009 but, as before, I will examine a more recent data set in detail too (2015 to 2019) where appropriate. I will be focusing once again on 8+ runner handicap races.
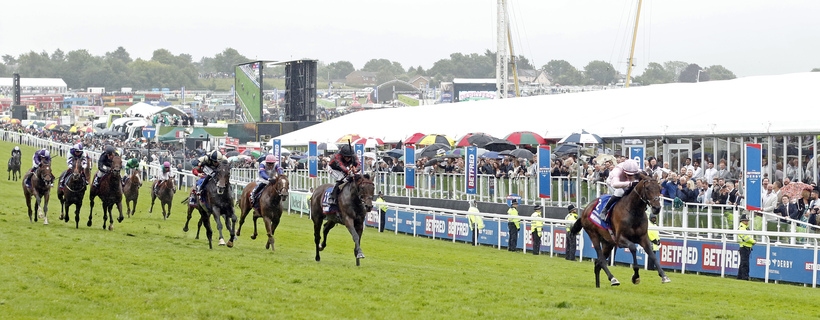
Ayr is a left-handed course roughly 12 furlongs in circumference and is generally considered to be a track that suits galloping types. The 5f and 6f races take place on a straight track, with longer races using the round course. As can be seen from the course map below, there are a number of undulations in the back straight and a dip then a rise in the home straight. The five furlong course is largely uphill.

Let’s start with the sprint distances:
Ayr 5 Furlong Draw Bias (8+ runner handicaps)
Since 2009 there have been exactly a hundred qualifying races so no need for a calculator to work out the draw percentage splits! Here are the 11 year stats:


High draws have been at a disadvantage looking solely at the win percentages for each third. Looking at A/E values, these show an excellent correlation with the draw win percentages:

At the minimum trip of five furlongs, both sets of data point clearly to high draws struggling.
However, before moving on, it is important to realise that Ayr is one of the rare courses where they use three different positions for the starting stalls. Here is the breakdown for each stall position:
Ayr 5f Draw Bias when stalls are in the centre (37 races)

With the stalls in the centre the figures are quite similar to the overall ones, although higher draws seem to struggle even more.
Ayr 5f Draw Bias when stalls are stands' side (39 races)

The stalls when placed stands’ side mean that higher draws are drawn against the near rail. It seems that higher draws are more competitive in this scenario, but as a general rule the ground next to that rail looks likely to be slightly slower than the centre or far side, as such horses still struggle.
Ayr 5f Draw Bias when stalls are far side (24 races)

Low draws are drawn right next to the far rail when the stalls are placed in this position and although the data is limited, those drawn on the far side seem to enjoy a decent edge. It will be interesting to see whether the six furlong data supports this (more of that later).
Ayr 5f Draw Bias (by going and field size)
There is no clear-cut going bias, and the same is true when analysing field size data.
However, in bigger field races (16 or more runners) there have been several occasions when individual races have apparently shown a draw bias. The difficulty lies in the fact that the bias is not consistent and has no clear pattern. Having said that, of the 19 races with 16+ runners since 2009, I believe that at least twelve have shown a significant bias. I won’t go through all of that dozen, but here is a flavour:
15/9/11 – a 17 runner race where low draws seemed in charge with horses drawn 4 and 1 filling the first two places and draw 2 was back in 5th;
21/9/12 – a 16 runner race where there was an even split with eight horses going far side (low) and eight coming stands’ side (high); 5 of the first 6 home raced far side;
19/9/13 – in this 20 runner race 14 horses raced stands’ side (high) and 6 raced far side (low). 11 of the first 12 horses home raced stands’ side with the first three horses home drawn 17, 16 and 18;
20/9/13 – a 24 runner sprint where there was an even split with 12 runners coming stands’ side and 12 staying far side; 7 of the first 8 home came from the stands’ side group (high);
19/9/14 – a 20 runner race where taking non runners into account the first 8 horses home were drawn 13, 15, 4, 12, 18, 17, 11 and 20.
15/9/16 – the first 8 runners home were drawn 1, 3, 7, 2, 8, 12, 6 and 4 in a 19 runner race;
13/8/18 – 5 of the first 6 home exited from double figure draws (16 ran).
For those interested in exotic bets, if you had hedged your bets in terms of not being sure whether low or high draws would be favoured, and permed both very high draws and very low draws in straight forecasts, you would have seen a huge profit across these 19 races. Perming the four lowest draws and also the four highest draws would have produced 6 winning bets from the 19 races. Assuming an outlay of £24 per race (2 x £12 perms) the outlay on these forecasts would have been £456; but the dividends would have combined to return a whopping £1074 giving a profit of £618. As I have stated before past profits are no guarantee to future profits, but selective draw focussed forecasts have served some punters very well over the years (including me).
It is time now to break down the draw by individual stall number. I use the Geegeez Query Tool to give me the relevant data:

Profits for draws 3, 4 and 6 which given their grouping suggests again lower rather than higher draws are often the place to be.
Ayr 5f Draw Bias (2015-2019)
Homing in on a more recent data set, looking at the past five seasons (2015-2019), below are the draw splits for the 37 races that have occurred during this time frame.

As can be seen, high draws have struggled even more in recent years but, interestingly, middle draws have performed particularly well. 37 races is a relatively small sample but it does seem that middle draws currently hold sway.
The A/E values correlate with the draw segment percentages above:

Below are the five-year stats for individual stall numbers:

A blind win profit for just draws 1 and 6, those two stalls book-ending the section to be: that six-berth segment has secured 27 of the 37 races with an A/E of 1.07. Their overall strike rate is 12.2%, whereas horses drawn 7 or higher have won 10 races with a strike rate of 4.4% and an A/E of just 0.54.
Ayr 5f Pace Bias (8+ runner handicaps)
Let us look at pace and running styles now. The overall figures (2009-19) are thus:

There is a clear edge for front runners and those racing close to the pace (prominent) – as we know from previous articles this is the norm over 5f at most courses. It is not the strongest front-running bias around but still significant enough.
If we look at medium- to smaller-sized fields (8 to 12 runners) front runners seem to enjoy a slightly stronger edge:

I also had a look at the 19 races discussed earlier with big fields of 16 runners or more. Amazingly, 13 of the 19 races were won by horses that raced prominently (A/E 1.32).
I have checked ground conditions and there is nothing noteworthy to share.
Ayr 5f Draw / Pace Combinations
Finally in this 5f section a look at draw / pace (running style) combinations for front runners over this minimum distance. Remember this is looking at which third of the draw is responsible for the early leader of the race (in % terms):

I had expected this even split especially considering the variations in stalls positions.
Here is the draw/pace heat map, displaying Percentage of Rivals Beaten. A score of 0.55 or greater is material:

The image clearly shows the benefit of racing on or close to the lead, and ideally not being drawn too high.
Ayr 5f Draw / Pace Bias Conclusions
In conclusion, low to middle draws have the edge over five furlongs in handicaps of eight-plus runners. I highlighted draws 1 to 6 in the more recent 5-year data as having a definite edge over higher draws – looking at the full 11-year dataset this has been the case, too. Draws 1 to 6 have won 71 races from 600 runners (A/E 1.07); draws 7 or higher have won 29 races from 596 runners (A/E 0.56). Pace wise, front runners fare best followed by horses that race close to the pace (prominent).
*
Ayr 6 Furlong Draw Bias (8+ runner handicaps)
The six furlong trip has had 171 qualifying races between 2009 and 2019 which equates to around 15 races per year, a decent sample. Here are the win percentages by draw third:

Low draws seem to have a small edge here and as with the 5f data high draws have had the worst of it. Having said that high draws have been at a bigger disadvantage over five furlongs than six.
Let’s look at the A/E values to see if they correlate with the draw percentages:

Low draws seem to have offered decent value overall – higher draws have a poor figure of 0.60 which is similar to their figure over the minimum (0.56).
Onto examining whether the position of the stalls have made any difference:
Ayr 6f Draw Bias when stalls are in the centre (72 races)

With the stalls in the centre it has been a very even playing field in terms of the draw over 6f.
Ayr 6f Draw Bias when stalls are stands' side (53 races)

The stalls when placed stands’ side (high) seem to put higher draws at a distinct disadvantage. This is surprising from a logic perspective, but again seems to highlight that the ground near to the stands’ rail tends to be slower than the rest of the straight track.
Ayr 6f Draw Bias when stalls are far side (45 races)

As with the 5f stats, the 6f results give those horses drawn next to the far rail (low) a decent edge. However, before we get too excited, in 2019 there were no races at all with the stalls placed on the far side over five or six furlongs. I am not sure why this was the case: what does seem to be happening is that, as the years go by, more races are seeing the stalls placed in the centre of the course. In 2019 over 5f and 6f just under 70% of all races had the stalls placed in the centre. I wonder if course officials are attempting to make sprint races ‘fairer’ in their eyes by trying to encourage horses to come down the centre of the track.
Time to look at how individual draw positions performed over the 1- year period between ’09 and ‘19:

As you would expect with so many races very few stalls show a blind profit; draws 26 and 27 are two of the three but from very small samples. Draws 1 to 4 have fairly decent A/E values which is worth noting.
It could be reasonably argued that a draw close to either rail is an advantage. To that end, field size does seem to have some impact – in smaller fields of 8 to 10 runners high draws have struggled, winning just 14 of 82 races (SR 17.1%) with an A/E of 0.43. In big field races (16+) higher draws have performed much better, winning roughly a third of the 38 races (13 wins).
In terms of ground conditions it seems that lower draws enjoy more of an edge when the ground eases. There have been 78 races on ground described as good to soft or softer over 6f since 2009, of which low draws have won 36 (SR 46.2%). The A/E value is positive, too, at 1.14.
One of the biggest sprint handicaps of the year occurs at Ayr over 6f - the Ayr Gold Cup - run towards the end of September. In addition to the Gold Cup, there are two consolation races – the Silver Cup and the Bronze Cup. Traditionally, the Gold and Silver Cups are raced on the Saturday with the Bronze Cup on the Friday.
Since 2009 there have been ten renewals of each race at Ayr (the 2017 Bronze and Silver Cups were not run due to the meeting being abandoned, while the Gold Cup was switched that year to Haydock). These races always have big fields (average field size is 25) and hence the draw can potentially play a big part. Looking at the races in detail I would estimate that 20 of the 30 races (66.6%) displayed a draw bias; be it one third strongly favoured, or one third being strongly disadvantaged. Earlier in the article it was noted with bigger field 5f races that draw biases had the potential to occur, and we are seeing a similar pattern here.
Unfortunately, just like the 5f races, it has not been easy to predict which part of the track, if any, will be favoured. Having said that digging deeper has uncovered a potential opportunity. Seven of the Bronze Cups seemed to show a draw bias; when this draw bias occurred, the same or a very similar bias occurred the same year in the Silver Cup in four of the seven corresponding races. In the four years where the Bronze and Silver Cups had similar draw biases, the Gold Cup displayed a similar bias in three of them and, it could be argued, in the fourth as well. The best example of this happened in 2016:
In the 2016 Bronze Cup it was clear high draws were at a disadvantage. Seven of the first eight horses home were drawn in single figures (5, 7, 8, 17, 6, 1, 9, 3) – 24 ran; in the Silver Cup the following day, low to middle held sway again with five of the first eight home drawn in single figures and best finish from the top third of the draw was 9th (25 ran). The Gold Cup which followed just over an hour later saw low to middle again in charge with draw 8 beating 6 with 7 back in third; draws 11, 10, 14 and 4 filled the next four places (23 ran). Again, there was no sign of a horse from the top third of the draw.
Ayr 6f Draw Bias (2015-2019)
Onto the last five seasons now for 6f handicaps at Ayr. There have been 79 qualifying races since 2015, with the draw splits as follows:

High draws have really struggled in recent years. Consequently, to some degree, low draws have had the best of it.
The A/E values (2015-2019) underpin that notion:

There is an excellent correlation between the draw third percentages and the A/E values which adds confidence to the data.
Now a look at the individual draw figures for this latest 5-year period:

Draws 2, 4, 5 and 6 have all shown a profit in the win market, again highlighting the low draw edge in recent years. Those drawn 21+ in very big fields have also performed well from a small number of qualifying races.
Ayr 6f Pace Bias
Below is a breakdown of pace and running styles. Here are the overall numbers going back to 2009:

These figures show that front runners have an edge and it is a similar edge to the one such forward-going types enjoy over five furlongs.
In big field races the edge for front runners is wiped out, and looking at the data for the Bronze, Silver and Gold Cups, horses that raced mid-pack have definitely over-performed albeit from a relatively small sample of 30 races.
When the going gets testing the front running bias has increased. There have been 40 races on soft or heavy ground since 2009 and here are the pace splits (NB. One dead heat):

The further you are from the early pace the worse it seems to be on soft or heavy going.
Ayr 6f Draw / Pace Combinations
A final table in the 6f section is a look at draw / pace (running style) combinations for front runners in 6f handicaps (2009 – 2019):

It is interesting seeing more low drawn horses getting to the lead over 6f. I'm not sure why that is and, as stated earlier, considering the fact there are three varying stalls locations, one would have expected a more even split.
Again, the heat map highlights the benefit of being forwardly placed, and the difficulty that high drawn later runners have experienced.

Ayr 6f Draw / Pace Bias Conclusions
In conclusion, lower draws have held sway over the last decade or so with the bias seemingly getting stronger in the past five seasons. High draws have really struggled recently except when the stalls have been placed in the centre. The shame for draw bias fans, as I noted earlier, is that more and more races seem to have the stalls placed in the centre over 6f at Ayr. Pace wise, it is again those racing on the front end who have the upper hand and this seems to strengthen as the ground gets softer.
*
Ayr 7 furlongs Draw Bias (8+ runner handicaps)
The seven-furlong trip takes in the round course with low draws positioned next to the inside rail. There is a sharp turn soon after the start where runners can get fanned quite wide into the home straight.
170 handicap races have been run with eight or more runners since 2009. Here is the draw breakdown:

That is about as even a split as you could get! So low draws, despite potentially having the chance to take the shortest route around the turn, do not have any obvious advantage. Onto the A/E values:

A commensurately even set of figures, as might be expected. The market looks to have it pretty much spot on.
However, field size does seem to matter from a draw perspective as races with 12 or more runners illustrates:

As the field size increases so horses drawn wider start to be disadvantage. This makes sense as the widest drawn horses are likely to have to run further if staying out wide on the track, or risk trouble in running if making their way towards the inside rail. The A/E figures correlate with the draw percentages for these bigger fields.

Looking now at ground conditions, high draws also seem to struggle as the ground gets softer. On soft or heavy ground there have been 43 races with the following draw splits:

The A/E values correlate neatly once again:


So although the basic statistics suggested little interest from a draw perspective, we can see that in bigger fields and on soft/heavy ground high draws do seem at a disadvantage.
Combining 12+ fields on soft or heavy has seen only 20 races but the bias against high draws is clear to see with just two victories from that third of the draw (10 wins for low draws and 8 for middle draws).
Let us look at the individual draw positions next:

Little to report here as one might expect – just stall 8 in profit which essentially is down to chance.
It is time to check out the more recent subset of data, from 2015 onwards. There have been 97 qualifying races giving the following draw breakdown:

This correlates strongly with the 11-year full set, with an extremely level playing field in terms of the draw. The A/E values again match up with the draw percentage figures:

For what they are worth here are the individual draw positions:

Randomly, four stalls are in profit; but that is all that it is... random.
On soft/heavy ground in the last five seasons high draws have struggled, as they did when examining the 11-year stats – they've recorded just four wins from 22 races (18.2%). Low draws dominated this period winning 13 of the 22 races (59.1%). Likewise, in bigger fields (12+ runners) high draws have found it hard winning just six of the 34 races (17.6%).
Ayr 7f Pace Bias
A look at the overall pace data now (2009-2019):

Front runners seem to have a slightly stronger edge when compared to the two sprint distances. The 1.41 A/E value is above the average A/E for all UK courses over 7f which stands at 1.26, as is the IV score of 1.80 (UK course average IV for front runners in 7f handicaps is 1.63).
As a reminder, over six furlongs the edge for front runners seemed stronger on soft/heavy going, and that seems to be the case here, too. The sample size is 42 races:

1.82 is a noteworthy A/E value, and is coupled with a score above 2.0 for Impact Value. This is material.
Ayr 7f Draw / Pace Combinations
Finally over 7f a look at draw / pace (running style) combinations for front runners in 8+runner handicaps (2009 – 2019). One might have expected low draws to lead more often as they have the inside berths:

These figures surprised me – clearly for some reason jockeys drawn low are not taking advantage of the inside rail. This is also the case in bigger field races where low drawn runners only take the lead 30.8% of the time.
The heat map below - all 8+ runner 7f handicaps - shows clearly where you need to be: front rank and drawn low to middle.

Ayr 7f Draw / Pace Bias Conclusions
To conclude, over 7f the draw in general is extremely fair, but on soft/heavy ground or when the field size reaches 12 or more, higher draws then start to be at a disadvantage. Pace wise it is front runners who are clearly best.
*
Ayr 1 mile Draw Bias (8+ runner handicaps)
With this article on the long side I am going to very briefly look at one more distance: the 1 mile trip. I will start by looking at the 2009-2019 data. There are 167 races in the sample, giving the following draw splits:

There is no clear draw bias on the basis of these stats and, sadly, digging deeper unearthed no pleasant surprises like there were over 7f.
However, going back to the late 1990s, this mile trip had a significant bias to those drawn next to the inside rail (low). I will use the 5-year comparison data method I used in the second Chester article to illustrate how the bias has essentially all but disappeared.
To recap, using 5-year data sets is a good way to try and compare any shift more effectively than simply looking at single years. This method highlights where patterns or biases are changing, as well as giving more reliable sample sizes. So here are the Ayr 1 mile figures going right back to the first data set (1997 to 2001):

As the table shows, low draws completed dominated until about 2005; since then the advantage gradually began to level and, for a while, low draws actually produced the lowest percentage of winners. In the last two or three seasons there has been a slight resurgence but, essentially, the days when I used to make money from the draw at this particular course and distance are long gone.
The reason? Difficult to say unequivocally but, interestingly, the maximum field size changed in 2006 from 20 to just 14. That might well be the material factor.
Ayr 1 Mile Draw / Pace Combinations
A quick look pace wise at the 1 mile trip but the front running edge seen at 5 to 7f is no longer prevalent.

Prominent runners arguably have a slight edge while front runners find it far harder to win over this extra furlong.
The draw / pace heat map confirms the generally fairer distribution of performance in terms of stall location and run style in Ayr mile handicaps.

*
I hope this article offers some helpful pointers now racing resumes at Ayr; I will be eagerly awaiting the 3 day September meeting which is one of my favourites, but there could be plenty of benefit between now and then, especially if the weather turns wet!
- DR
Other Recent Posts by This Author:
- Royal Ascot 2026: Must Know Betting Angles
- Analysing Racing Post Ratings (UK Flat)
- Analysis of 3yo and 3yo+ Maiden Races
- Instant Expert for 5f Handicaps: An Analysis
- A First Look Under the Instant Expert Bonnet


Superb Analysis Dave, thanks very much !
Excellent Analysis
Thanks for the article, I am a bit confused though!
The article states that in 5f races, those who lead or race prominently have an edge yet when I look at the 3:40 race today, the pace tab says those that race mid division or held up have the edge? Grateful for some clarification here, I think I’m missing something!
Hi Eddie
You are missing something, but it’s an easy mistake to make.
Dave’s research covers all 8+ runner handicaps on all ground. The pace tab is set specifically to similar field sizes and going to today’s race (so 7-10 runners, good/firm ground).
Those parameters can be changed as you wish and, if you change them to include all going/8-16+ runners, the data will match Dave’s.
Hope that makes sense.
Matt
p.s. I’m excited to see how National Anthem handles this faster ground. He’s electric from the gate but does tire commensurately late in his races. Hasn’t stopped him winning three of his last five in that manner, mind!
Cameron Hardie would temper my enthusiasm on that bet Matt his record over a 5f trip is shocking
Well stats are always there to be broken , well done Matt
Thanks Rooster. I’m all about early pace in 5f sprints. Particularly around a turn, but in a race where there were only two obvious forward horses, one of them a cert to go on, thought he was over-priced. Have to say also that I thought Bottle would run him down with his proven 6f stamina. 17/2 this morning, paid for most of a rather large losing bet on the Win 6…
Comments are closed.