Read all sorts of commentaries and tips across a range of racing disciplines on the most popular horse racing blog in Britain, from staff and guest writers.
This is the third in my series of articles on draw and pace bias at UK courses, writes Dave Renham. Pontefract and York were the first two to come under the spotlight, and now it is the turn of arguably the most draw biased track in the country, Chester.
Chester is by all accounts a lovely place to go and watch racing and, as I write this piece entering the fourth week of lockdown due to the coronavirus, the Roodee is a course that I will make every effort to visit in the future. It lies close to the River Dee and is officially the oldest racecourse in the world, dating back to 1539.
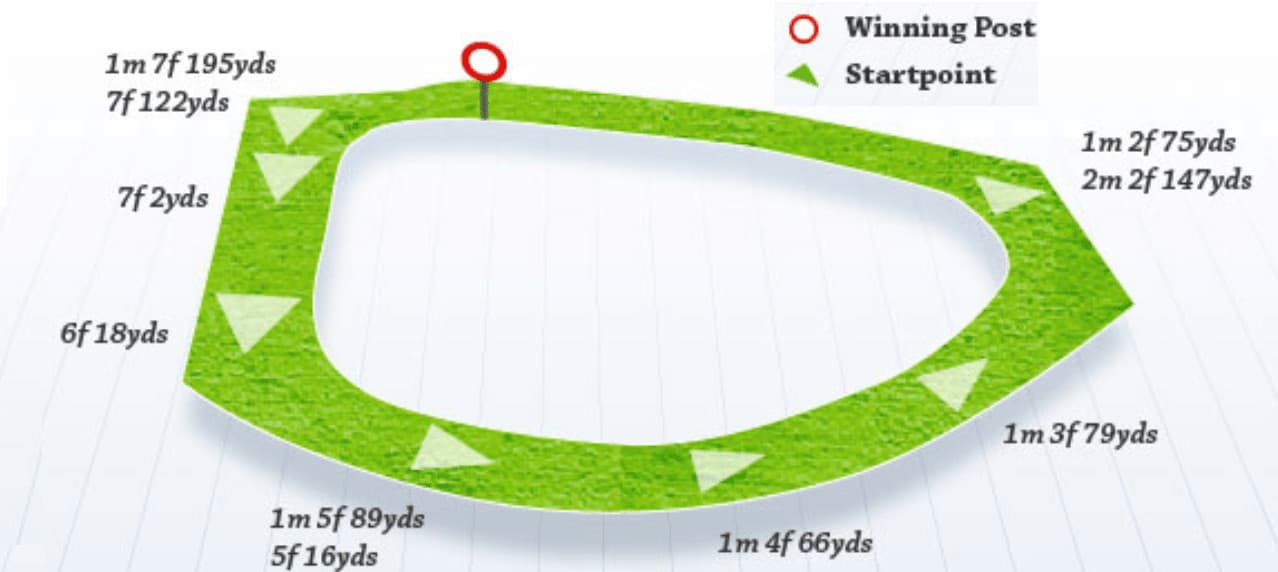
Chester Racecourse is a very tight track only just over a mile in circumference, which means that it does not suit long striding horses because the runners are so frequently on a left-hand lean. The home straight is only 240 yards in length - barely more than a furlong - which tends to help horses close to or on the pace. Traditionally, lower drawn horses near to the inside rail have had a decent edge at most distances. This bias is well understood across the racing fraternity, though, so whether we can actually get a worthwhile betting edge constitutes the purpose of what follows.
Chester Racecourse Map
As with the last two articles, I am using some of the tools available on the Geegeez website: Draw Analyser, Pace Analyser and the Query Tool. The main period of study is a long one, going back to 2009, but I will also examine a more recent (2015 to 2019) data set in detail where appropriate. I will be focusing once again on 8+ runner handicap races only and looking exclusively at the distances from 5f to 7f.
When looking at each race I will be dividing the draw into three equal sections (low, middle, high). This is how the Geegeez Draw Analyser does it and has been the way I have generally done it for 25 years. Draw positions are also adjusted when there are non runners to make the data as accurate as possible. For a strong draw bias I am looking for a figure of over 50% for one ‘third’ of the draw, and I am looking for this starting point to ideally correlate with other metrics such as A/E values.
Chester 5 furlongs (8+ runner handicaps)
Since 2009 there have been 86 races that have qualified. I have also included races over five and a half furlongs, of which there of which there were 29. Here are the overall draw splits:
As can be seen, very strong bias exists which has been consistent year in year out. Below I have split out the 5f data and 5½f data for interest:
The low draw figures mirror each other, but the middle and top thirds seem to ‘reverse’. Possible reasons could be that high draws really don’t have enough time to recover over 5f, whereas the extra half furlong gives them more of an opportunity to get back into it. It could be that middle draws get ‘squeezed' somehow over 5½f. Of course it could perfectly conceivably be down to random results as there were only 29 races in total for the 5½f stats.
Onto A/E values now (5 and 5½f races) and low draws have actually offered value over the longer term:
In terms of breakdown, the five-furlong races produced a low draw A/E value of 1.05, whereas races over 5½f had a slightly better value of 1.14.
It is time now to look at each draw position broken down by individual stall number (5f and 5½f):
As we can see, stalls 2, 3 and 4 have all made a blind profit to SP, and stalls 1 to 4 have provided 63 of the 86 winners which equates to 73.3% of all races. Horses drawn 11 or wider have provided just two winners from 74 runners with only three others getting placed. The huge advantage to low draws is clear.
We can consider that macro picture in context by looking at a more recent data set covering the past five seasons (2015-2019). Here are the draw splits for this shorter time frame (total races 42):
Low draws have been consistently winning at greater than the 60% mark so on the face of it the bias seems as strong as ever. For those who like exotic bets, doing a reverse forecast on the two lowest drawn horses would have netted you an amazing ten winning bets in 42 races. Now the dividends varied greatly as they are dependent on the prices of the horses that fill the first two places. Three of the dividends paid under £10, but two paid between £50 and £70. If you had placed a £1 reverse forecast on all 42 races going back to 2015 you would have been in profit by an impressive £182.41. For any tricast punters out there, if you had permed the three lowest draws in 6 x £1 full cover tricasts, you would have won 4 times and netted a profit of £189.85. I cannot guarantee such returns in the future but it is certainly food for thought.
Here are the 5 year stats for individual draw positions:
In this shorter snapshot, 71.4% of all races have been won by horses drawn 1 to 4, which correlates with the 11 year figure of 73.3%.
Despite everything looking very rosy still for low drawn horses and amazingly still producing some profitable angles I do have a word of caution: I think there are signs that the bias is getting less strong, more notably in the past two seasons. If you look very closely at the 2018-2019 results as a whole, the low draw bias seems less pronounced. Now there have only been 15 races during these two seasons so it could simply be an anomaly due to an extremely small sample.
However, there is a reason why I think this might be the case rather than simply hypothesising over a set of numbers. In the last two seasons 12 of the 15 qualifying races (80%) have been run with the inside rail having been moved. This is almost certainly an attempt by the course to try and nullify the bias as best they can – indeed rail movement has risen from 22% in 2016 to 50% in 2017 to this new figure of 80% during the past two seasons. The rail movement is also not consistent from meeting to meeting having moved different distances ranging from a minimum of 10 yards to a maximum of 33 yards.
Digging deeper into these very recent results, in the three races when the rail was not moved in 2018/19 all three races were won by low drawn horses – in fact both 1st and 2nd were filled every time by horses drawn either 1, 2 or 3. In the 12 races where the rail was moved, less than half of the races (five) were won by the bottom third of the draw and generally the races looked far more even when looking at placed positions too. As mentioned above, the data set is far too small to be anywhere near confident, but it will be interesting to see if this emerging pattern continues in the near future.
Let us consider pace and running styles now. For the pace section I am going to study just the overall figures (2009-19):
A significant edge has been to front runners which win roughly three races in every ten while, in contrast, hold up horses are at a huge disadvantage here. That is almost solely due to the tight turning nature of the track, especially at this trip, coupled with the very short straight. Hold up horses just haven’t got enough time to pass the many runners that would be in front of them as they straighten up for home. The figures are very similar for both the 5f distance and the extended 5 furlongs (5½f). Front runners also produce an impressive A/E value of 1.84.
In terms of whether the going makes a difference, the figures are fairly even across the board although on good ground (34 races) the win percentage for front runners edges up to just over 34% with an IV of 3.79. I don’t personally believe the front running bias is stronger on good ground – the place data is no stronger for example - but I felt it was worth mentioning.
In terms of field size and the number of runners, the front running bias seems strong across the board; it is possibly slightly stronger in smaller fields but when you split the data up some of the sample sizes are a little small to confidently make that inference.
Now a look at draw / pace (running style) combinations for front runners in these 5f races. Remember this is looking at which third of the draw is responsible for the early leader of the race (in % terms):
As one would expect, the early leader comes from lower draws more than half of the time; it is clearly difficult to lead early from a wide draw which makes perfect sense given the appeal of such a position and the topology of the course. It is also easier to win having led early from a low draw rather than from a middle or high draw. Low drawn early leaders have gone onto win 37.2% of their races (23 wins from 61) – an impressive stat.
Having said that the figures are still solid from middle and higher draws: middle draws have won eight times from 35 (SR 22.9%) when leading early, and high draws have won four from 14 (SR 28.6%). Digging deeper, horses that take the early lead from stalls 1 and 2 do lead more often than any other draw and go on to win around 40% of the time.
Below is the draw/run style heat map, displaying place strike rate, for 8+ runner five- or five-and-a-half furlong Chester handicaps since 2009:
The summary is that the combination of a low draw coupled with good early pace, or at least the ability to lead, is extremely important at Chester over 5f.
Chester 6 furlongs (8+ runner handicaps)
The 6f distance is run less regularly than the 5f / 5½f one, with 66 qualifying races going back to 2009. Here are the overall draw splits:
The strong low bias seen at 5f does not occur in the same way here with middle draws being almost as successful as low draws. What is clear however, is that there continues to be a strong bias AGAINST high draws. The A/E values illustrate that middle draws have definitely been the value:
A look again at individual draw positions and how they have fared over this time frame:
Although the lowest third of the draw did not totally dominate the win percentages, draws 1 and 2 have been very successful in terms of wins: 25 wins out of the 66 races equates to just under 38% of all races won by the two lowest boxes. Both have made a blind profit – draw 1 having performed particularly well. It should be noted, not unexpectedly of course, that double figure draws have provided just one winner from 118 runners!
Looking at ground conditions it is possible that firmer ground accentuates the bias against higher draws a little, which seems logical also. On good ground or firmer the top third of the draw have won just 4 races from 38; on good to firm or firmer they have won 0 from 12 races with only 5 horses placing. Limited data, yes, but something to bear in mind I feel.
Onto the last five seasons now. Although there have been only 30 qualifying races since 2015, I believe it is still worth sharing the draw splits:
High draws have continued to struggle in the more recent past, while middle draws have performed slightly better, and the centre is where the value seems to be once again. Double figure draws have secured zero wins and just four places from 46 runners. For A/E values I am going to split the data by draws 1 to 4, then 5 to 8 and finally 9 or higher:
Again, it appears that draws 5 to 8 have been the value stalls in the past five seasons.
Let's break down the individual draw figures for the last five seasons, 2015 to 2019:
With only 30 races in the past five seasons the individual stall data is rather limited and I personally would not read too much into it. Stall 1 has performed well as one might expect in the context of the 11 year data shared earlier.
Below are the running style figures for 6f 8+ runner handicaps at Chester, going back to 2009:
These figures show that front runners have a decent edge while horses that track the pace also perform above the expected ‘norm’. Horses that race mid pack or at the back early are at a clear disadvantage for the same reason that they are over 5f: the short straight makes it very difficult to win when coming from off the pace. Horses held up in the back are worse off than horses that race mid-division.
This pace bias AGAINST hold up horses strengthens as the field size increases. The table below looks at the 11 year splits for the 32 six-furlong handicap races with 11 or more runners:
As can be seen, there were no wins at all for hold up horses, whereas 26 of the 32 races were won by horses that raced close to or up with the early pace. The majority of races (18 of 32) were won by prominent runners, though there were, naturally, more prominent races than race leaders and their peer group strike rates are very similar.
Now a look at draw / pace (running style) combinations for front runners in 6f handicaps (2009 – 2019):
Over 60% of the races have seen the early leader come from the bottom third of the draw (low), a percentage that is even higher than the 5f data. This is a very high figure and worth noting.
The 6f trip does not give low draws the edge, however, as it does over 5f. Rather, only the two lowest stalls as noted earlier have managed to win consistently more than might be expected, taking roughly 38% of all races.
Horses drawn 10 or higher have had little or no chance of winning throughout the eleven-year sample period.
Pace wise, early leaders and prominent runners are clearly most favoured.
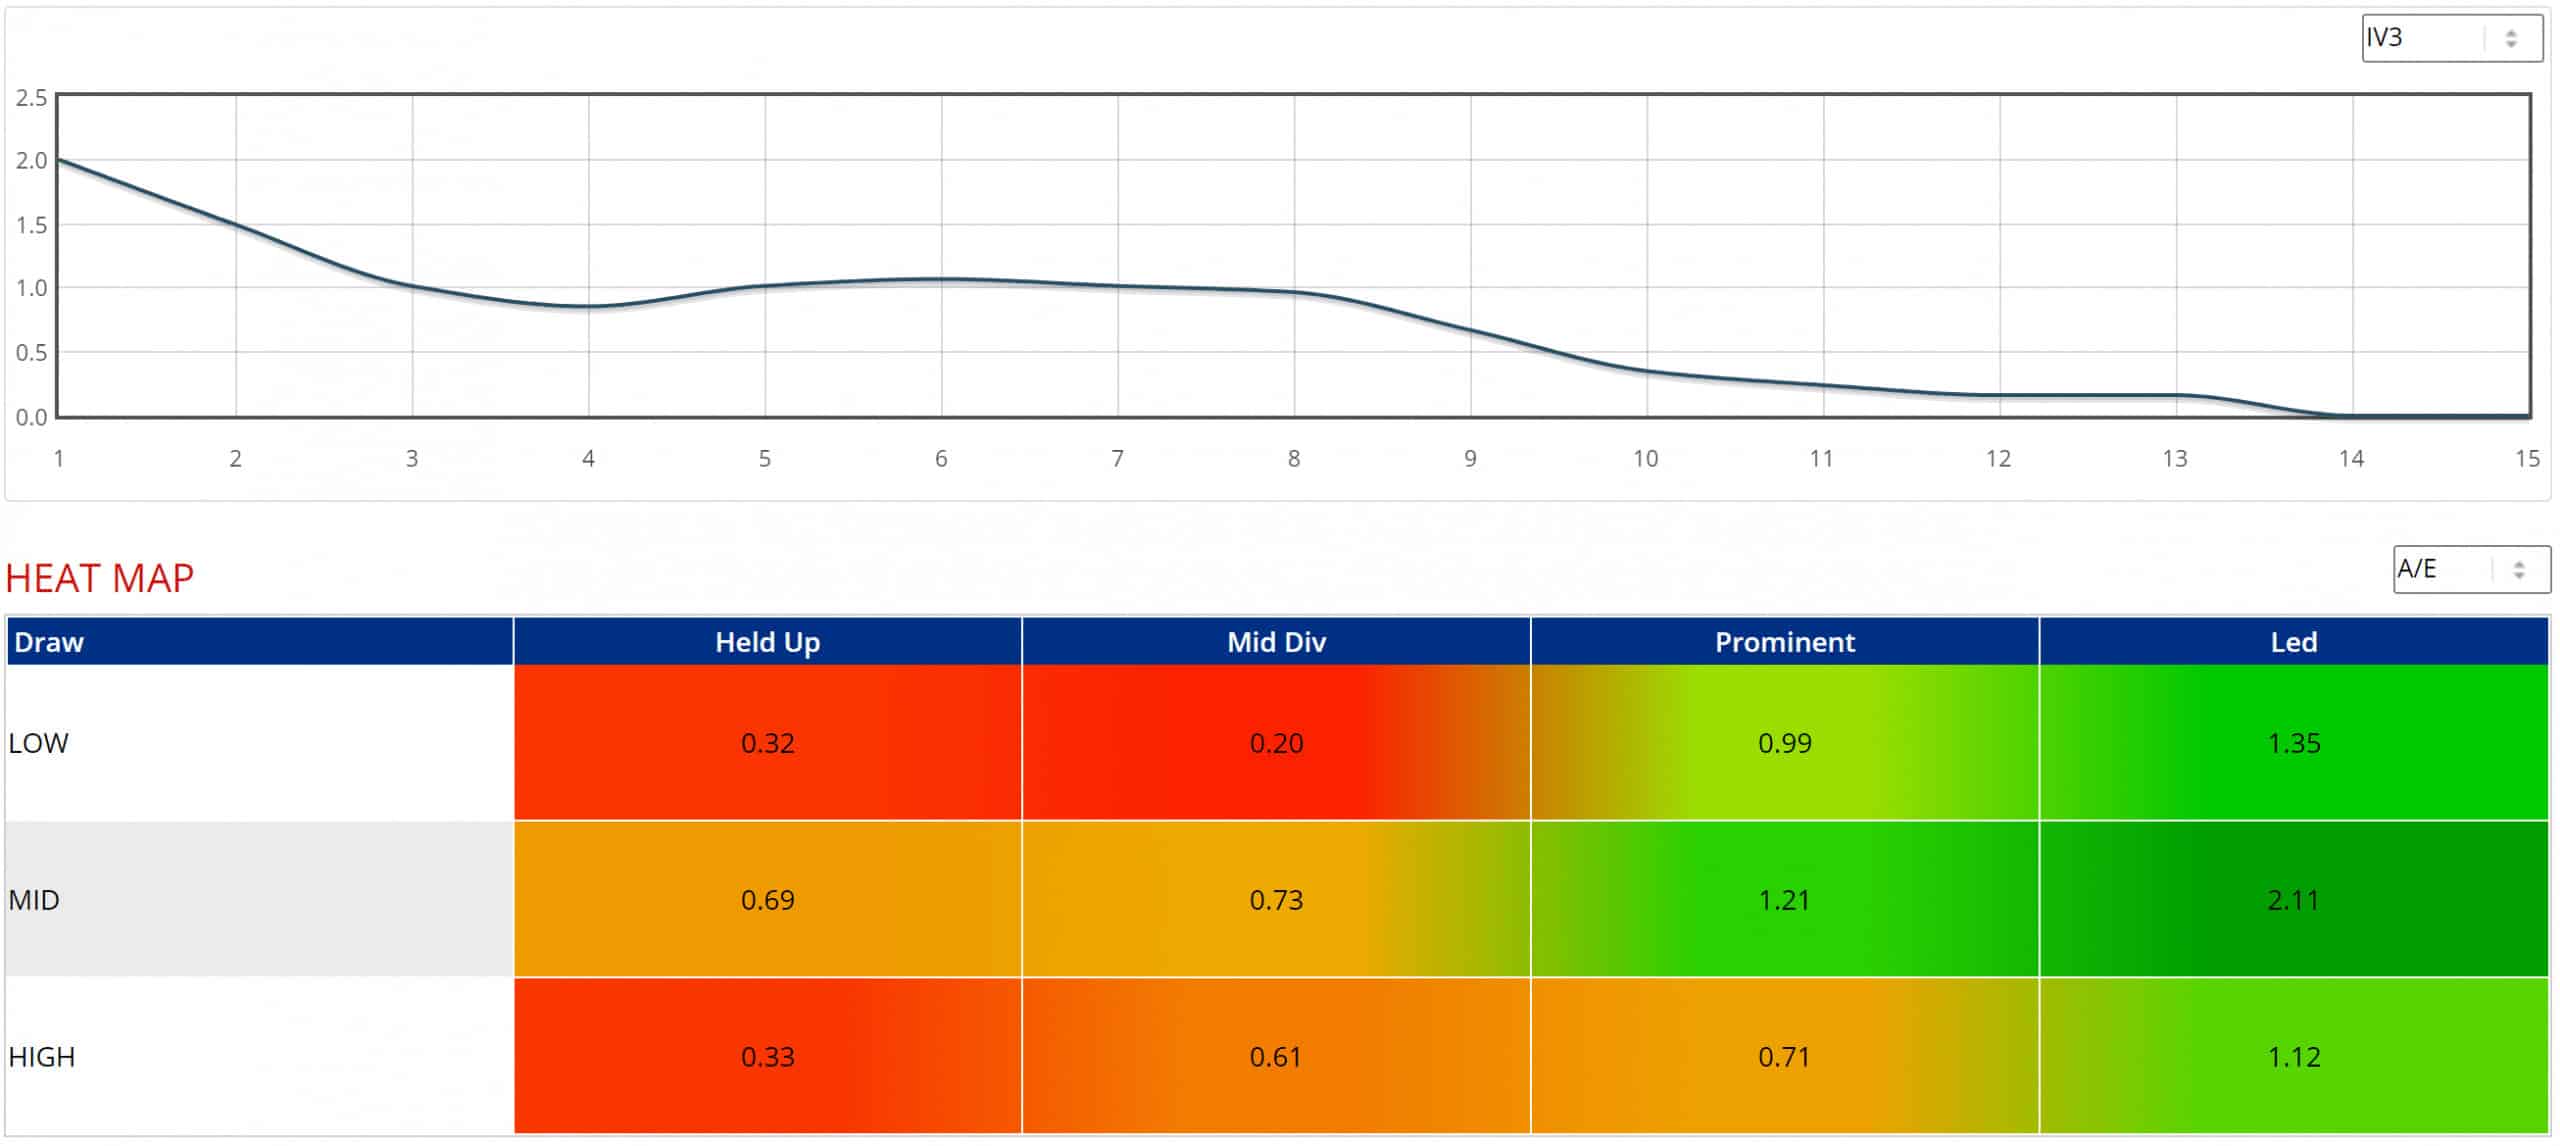
The graph (sorted by IV3, the average Impace Value of a stall and its immediate neighbours) and heat map (displaying A/E) below both illustrate this:
Chester 7 furlongs (8+ runner handicaps)
There are two 7f distances at Chester, one over 7f and the other over 7½ furlongs. In this article I am going to look solely at the shorter distance of the two. I plan to look at the extended 7f trip in a subsequent 'Part 2' article. Since 2009, over 7f there have 75 qualifying races.
Low draws have had a strong edge having been responsible for just over half the winners. The A/E values look like this:
The market definitely factors in the advantage that lower draws generally have here, an A/E figure of 0.94 implying that there is a slight negative expectation from backing such runners. Having said that there may still be some value in backing selected lower drawn runners.
Let us now look at each individual draw and its associated stats since 2009:
36 of the 75 races were won by one of the three lowest stalls, but only draw 1 has shown a blind profit during the long period of study.
When checking the data for specific ground conditions the stats suggest that on softer ground the low draw bias increases. On good to soft or softer there have been 37 races of which 22 (SR 59.5%) have been won from the bottom third of the draw (low). The A/E value nudges up to 1.09, and backing all low drawn horses would have secured a small profit to £6 to £1 level stakes at SP.
Time now to switch attention to more recent results and the past five seasons. Here are the draw splits for 2015 to 2019 (total races 33):
The bias has been similar in this shorter time frame although in medium to bigger size fields the results have been quite even. Low draws have dominated in 8 and 9 runner races, but as I have said before it is generally not smart be too dogmatic about results when looking at very small samples.
Let us look at the individual draw figures for 2015 to 2019 (33 races):
Horses drawn 3 have done well, but although very low draws have had an edge, when looking closely at this table I am starting to think that the bias has not been as strong in recent years. My main reservation is that the place percentages for draws 1 to 7 are relatively similar and also the A/E values for draws 7 to 10 are higher as a group than draws 1 to 4, suggesting that any value that might exist is in that counter-intuitive area of the stalls.
The great thing about statistical research is that different individuals will interpret the data in different ways. This is simply my view: I could be wrong and once again it needs to be said that 33 races is still a very small data sample in which to have any real confidence.
Onto to 7f handicap running styles now. Here are the overall stats going back to 2009:
Front runners have had a fair edge with hold up horses again at a disadvantage. However, the bias is not as strong over 5 and 6f, with later runners having greater opportunity to get into a challenging position.
We actually have a reverse pattern to 6f in terms of field size. Over 7f front runners have had a huge edge in smaller fields: in races of 8 to 10 runners, (43 races in total) they have secured an impressive strike rate of over 28% with a huge A/E value of 2.24. I cannot explain why - perhaps it is because they are better able to stack the field up in behind and control the race - but the strike rates and A/E values do correlate strongly.
Finally let us examine the draw / pace (running style) combinations for front runners in 7f handicaps:
Low draws are once again more likely to lead as they are closest to the inside rail and thus have the least distance to travel. High drawn runners manage to get to the early lead in just one race in six on average. In terms of early leaders that have gone onto win the race, lower drawn front runners win more often (24.4%) than middle drawn ones (17.2%) who in turn go on to win more than high drawn front runners (13.3%).
It is also worth noting that hold up horses drawn low have won just once in 58 runs.
Combining the 5 to 7f data
Before I finish I wanted to combine all the data for the 5 to 7f distances at Chester (2009-2019). Firstly the draw splits:
Over half all of races in the full eleven-year study period were won by the bottom third of the draw; middle drawn runners have been roughly twice as successful when comparing them to higher draws.
Now the individual draw by draw data:
This table neatly demonstrates that despite the very well known low draw bias the very lowest draws continue to offer some value. Both draws 1 and 2 have made a blind profit to SP and both have A/E values in excess of 1.00, from a strike rate of almost 19%. The table also illustrates neatly that in general the higher the draw the lower the chance of winning: stalls 11+ have a collective win record of just six from 215 (2.8%).
The table below shows the combined pace data for 8+ runner 5 to 7f handicaps:
Looking at these figures, why on earth would you not try and get to the front at Chester over distances of 7f or less? Jockeys who hold up their mounts here by choice are either not trying to win or they don't know how to!
I hope this article has given you plenty of positive angles from which hopefully we can profit sooner rather than later.
- DR
https://www.geegeez.co.uk/wp-content/uploads/2018/04/chester_strongpacebias.jpg319830Dave Renhamhttps://www.geegeez.co.uk/wp-content/uploads/2022/10/geegeez_banner_new_170x78.pngDave Renham2020-04-20 10:14:322021-08-10 13:58:42Chester Draw & Pace Bias: Part 1
Logic told me time would pass slowly during lock-down. Five weeks in, it’s definitely speeded up, writes Tony Stafford. I spoke to my son twice last week, briefly on Sunday and then again for a few minutes more on Friday and I swore that there could only have been a couple of days between the two contacts.
Twin came around on BBC4 again on Saturday evening in my favourite 9 p.m. international drama slot and will already be finished by next weekend. Thankfully I’ve now joined BBC I-Player so I can have a second look on the confusing bits of that rapidly-evolving and brain-challenging eight-part (two each week) Norwegian epic when I get some time. I was very disappointed that Spiral, a series of series I most wanted to see and that motivated my joining, is not on the list.
The other evening it was still light when the Thursday 8 p.m. clapping reverberated from the flats all around. Racing fans in the UK, denied so much since the shut-down on March 18 and more so in Ireland, will have lost most markedly; along with the mainstream we all are aware of, the accelerating number of evening meetings, many of them over jumps, that bolster the normal spring racing menu have also been cancelled. Just to let you know, the days start getting shorter in nine weeks’ time!
The Racing Post’s online-only newspaper carries the cards, like Gulfstream Park and Tampa Bay, that have kept racing going in Florida. Like everyone else, the Post included, I expected the Wesley Ward juveniles on show at Gulfstream on successive early evenings last week to do a Lady Aurelia and blow away the opposition.
But both on Thursday and Friday, first the 30-100 shot Lime, a daughter of Iqbaal, and then Golden Pal, 1-2 (by Uncle Mo), contrived to show the trademark Ward early pace only to succumb in almost identical fashion to a single stronger finisher even though their races were over only four and a half furlongs.
This pair was reportedly among the planned Ward annual contingent for Royal Ascot but first that spectator-free entity needs to be confirmed as does secondly that overseas runners may be accepted if it does. Should they come, I’m sure the traditional fear in which they are held by home trainers may have been a little diluted, although there’s plenty of time for Wesley to build some of that extra physical maturity that his juvenile challengers always seem to display.
I’ve been intrigued by the identity of today’s evening offering at Will Rogers Downs and thought it might justify a little investigating. I wasn’t at all prepared for what I readily discovered on the web. Will Rogers Downs is a gaming (principally, of course) and horse racing venue in Rogers County, close to Tulsa, Oklahoma, and is operated by the Cherokee Nation.
That administrative area encompasses 14 counties in North-East Oklahoma and a local population of around 200,000 in one way or another descended mainly from Cherokee and two other Native American tribes.
If that wasn’t unusual enough, the jockeys and trainers will be totally unknown to most of us, unlike the stars who descend on Florida each winter and spring, especially with New York firmly shut down. For the record, Floyd Wethey, Jr. is the top rider so far in 2020 and Scott Young is leading trainer. Tonight’s 10-race card offers one quite valuable prize, a near £25k to the winner fillies and mares race. I won’t put forward a potential winner.
The gaming provides the prizemoney and the track keeps a chunk of all the race wagering. Gaming is also keeping the UK bookmaking companies going, and if the number of advertisements for casino betting that we see in the commercial breaks on most channels nowadays is indicative of betting levels in these odd times, gambling is probably going off the charts.
How the BHA must wish it could get its claws on even a small percentage of that massive cake, not that it would be right to do so (as we saw with the FOBT fiasco). Maybe they should ask Captain Tom to do a sponsored walking-frame-push around the Ascot paddock on his 100th birthday on Thursday next week while singing his chart-topping duet with Michael Ball of You’ll Never Walk Alone? The £23 million (probably more by the time you read this) by which his exploits will be aiding the NHS efforts exceeds the not-insignificant £22 million that the Levy Board is targeting to help racecourses and others through their troubled financial times.
Yesterday we went for a fourth walk of the lockdown, this time forsaking the Olympic Park, for the newly (at Easter) re-opened Victoria Park, which is in the opposite direction. The park had been closed for some time after that initial period when sunbathing and all the other indicators of holidays in good weather in the summertime caused a Government re-think. Everyone was doing the keep-out-of-the-way six-feet walk yesterday; there is no cycling and all the dogs including our Yorkie Josephina were on a lead.
What was obvious, though, was that while the ground is not yet showing any real suggestion of much new growth, the five weeks of drought, following hard on the months of near waterlogging, has already brought great cracks in the turf at some places.
Hughie Morrison has been kindly sending me a brief video every Friday of Ray Tooth’s big homebred and still unraced three-year-old Bogeyman going through his paces. Each week they have been working on the wonderful grass gallops, developed over many years by the Cundell family but now owned and managed by Sir James Dyson.
The Victoria Park phenomenon is extending into Berkshire as the colour of the terrain seems to be lightening week on week. How ironic, with barely a day’s racing after the turn of the year and before Cheltenham being staged on anything but soft or heavy ground, unless we get some rain soon, it will be firm or as near as makes no difference when we resume. Expect to see stand-pipes in the streets by July.
Finally, after hearing that he thinks racing should start as soon as possible – Nick Rust’s line at the weekend too – it was salutary that Mark Johnston has subsequently revealed he is in isolation at home after being quite ill after contracting Covid-19. It must be so frustrating, frightening even, with the Flat season still to start, for Britain’s winning-most trainer that the new norm is so alien. I’m sure that everyone in racing will be wishing Mark, wife Deirdre and their family and staff all the best in the coming trying days.
- TS
https://www.geegeez.co.uk/wp-content/uploads/2018/08/Mark_Deirdre_Johnston_RoyalAscot.jpg320830Tony Staffordhttps://www.geegeez.co.uk/wp-content/uploads/2022/10/geegeez_banner_new_170x78.pngTony Stafford2020-04-20 07:17:202020-04-20 07:17:20Monday Musings: Time Flying By
Under normal circumstances April and May is my favourite time of the year, both in personal “real-life” terms but also through the racing lens, writes Jon Shenton. Usually, as the flat season kicks into gear it is a period when I’d be at my most active in punting terms. This year there is a void, and I’ve as yet not wanted want to fill it with third tier US racing, or whatever other meagre scraps are on offer.
Before we begin, an uber-caveat: the date of the restart of the sport will go a long way to establishing whether data-driven angles have a strong role to play in this years’ flat campaign.
Sadly, it may be smart to keep certain angles in cold storage until the spring of 2021: a truncated campaign will quite likely manifest in all sorts of data anomalies for otherwise robust angles. Let me explain with a specific example.
Many of my favourite angles are early season specific. Several yards are typically fast out of the blocks and others have a more nonchalant approach to the first exchanges in the campaign, in result terms anyway. Avoiding some yards during the initial knockings of the turf season can be a prudent move. A case in point is Tim Easterby: the powerhouse yard has a colossal number of runners throughout the spring and summer months with performance notable by its variance over the course of the season as the below graph illustrates.
It’s not the most exciting data, illustrating only the yard’s win percentage. However, it clearly shows a seasonal variance: Easterby’s performance in April and May is moderate in comparison to the peak summer period. To give a feel for the scale, there are 642 total runners in April alone, so in horse racing terms the sample sizes are broader than most (the yard is also 0-from-29 in March).
Focusing on 2020, what happens now? It is pure speculation but for the sake of this article let’s assume the season starts in July. Ordinarily, this would be peak Tim territory assuming a standard racing calendar. The million dollar question is, would the yard be expected to drop straight into the usual July prolific form or will it build slowly like usual, allowing its animals to develop race fitness through visits to the track, peaking as a yard in September or later? Perhaps we will see neither and the yard will flatten their own curve.
It is very difficult to project with any confidence, especially when placed in the context of every other yard rethinking and rehashing their own usual blueprint, planning for and around a truncated season.
Arguably, all typical trainer patterns could be of limited relevance. I certainly wouldn’t back a usual Easterby July qualifier this year, at least until I had more evidence to show the yard had adapted to the revised topology.
However, we don’t give in that easily at geegeez. Yes, it is true that a data-driven gambler may have to tread carefully; but there is also such a thing as first mover advantage! By cutting through the noise more quickly than most, there may be opportunities to gain utility from the numbers as they happen. Within that, possessing a good understanding of the ‘norm’ is beneficial as it provides a head start in terms of knowing what to look for as racing awakens from its enforced hiatus.
One sensible starting point is to evaluate how trainers perform after a horse has had a long rest from racing. This year, most animals are going to be hitting the track after a sizeable hiatus when the sport re-commences. Knowing the trainers who perform well in these circumstances ought to be of use.
The table below (containing data from horseracebase) shows exactly this: it summarises trainer performance with horses returning after a break of 181 days or longer (UK flat turf races only, 2011-present, SP 20/1 or shorter). The SP cut-off is a personal choice and generally helps sort the wheat from the chaff in my opinion.
The insight is sorted in A/E order (Actual vs. Expected, assessing performance vs. the expectation of the market, 1.00 being par, anything greater being outperformance against market expectation) and a minimum of 100 runs are required to qualify for the table. There are plenty of points to discuss but we will begin with my eye being drawn to the four yards marked in yellow.
These jump off the page, predominantly due to their impressive strike rates around one-in-four win to run ratio. They are also bona fide prime flat racing organisations where value can be hard to come by so merit closer scrutiny.
Given the profile of these yards, it is surprising that the market seems to ever-so-slightly underestimate their lay-off horses: time and again these guys fire in winners after an absence. The length of time off the track is far from detrimental to their chances; in fact, it may be a positive indicator of intent. However, we, as the general punting public still subconsciously prefer the reassurance of a recent run. In the case of the highlighted yards (and several of the others) it is a wise move trying to ignore the long elapsed time between runs.
Taking this concept further, the graph below illustrates the same trainers contained in the original data table above. The red line shows the A/E performance for the horses returning to the track after more than 180 days by trainer, whereas the blue bars shows the A/E for those who have a run during the last 180 days.
In basic terms, virtually all these trainers perform more profitably with lay-off animals than they do with more recent runners (using A/E as the measure). The only three that do not are Messrs Balding, Prescott and Ryan, but even then, the difference in results is virtually negligible.
The left-hand side of the graph indicates those where the variance between the lay-off horses and the race fit animals is most significant. Ballydoyle maestro Aidan O’Brien heads the list. There is some logic in this, at least theoretically. It is not beyond imagination to speculate that a horse travelling across the Irish Sea to the UK is ready for action and means business. Were it not it would be running closer to home, presumably.
However, to satisfy whether that is a fair assertion or not, a comparison with the yard’s Irish return-after-a-break horses should confirm if this is the case.
As can be seen, O’Brien’s travellers outperform their stay-at-home counterparts on every measure. Whilst it is probably not angle material it is certainly worth factoring into big race considerations, especially if the money is down (the record for horses 6/1 or bigger is just 2-from-45 within the UK dataset).
Another trainer highlighted in the table with a large differential between the performance of his lay-off and recent runners is Roger Varian. The Newmarket-based operation is one that, considering its scale and profile, I do not particularly follow or have many related opinions / angles.
However, in the context of his layoff runners there is an interesting edge to consider when runners are evaluated by age.
The table demonstrates that the winning performance level of Varian’s three-year-olds after a break is not as strong as his older horse returners. This could easily be a sample size issue, particularly as the place performance is very consistent. Regardless, the numbers of the four years and older brigade are highly noteworthy.
Taking those four-plus aged horses and evaluating their performance after an absence against the yard’s performance where a run has been more recent, the numbers grow in stature still further by comparison.
Effectively, the table above confirms that the absolute right time to back a Varian horse aged four or older is its first run after an absence.
I dare say that this is the tip of the iceberg and there are plenty of other interesting data-driven nuances in relation to all trainers in the table. A bit of homework for me – or you? – over the next week or two perhaps.
Again, 2020 may prove to be wholly different from recent history given these unique circumstances. Normally, much of the value in these yards horses after a break can be attributed to the likelihood that much of their competition would have had a recent outing: the beady eye of the market is often drawn to those who have provided recent evidence of their well-being rather than those who have been out of sight, out of mind.
This year, especially early in the season, most runners in each race will be racing on the back of a long break. It is conceivable that every yard and every owner will be desperate to get their charges out as early as possible to mitigate some of the economic damage received through the enforced absence.
Consequently, if the phasing of animals having their first run in a while is compressed into a short period of time as there isn’t the luxury of a long campaign, it could be easily argued that the market will focus more towards the likes of O’Brien, Varian, Gosden and Haggas given their elevated status.
If the mooted Royal Ascot behind closed doors meeting does proceed, virtually every horse will be hitting the track after a long absence. Gosden, O’Brien et al runners could be like moths to a light for punters, even more so than usual, eroding potential value from the lay-off angle.
However, the bottom line is that these yards have proven performance after a lay-off in their locker. Plenty of others do not and those others will have to elevate their game and do something uncharacteristic to their norm to prevail.
Of course, it is conceivable that trainers who build a horse’s fitness through racing will adapt easily. Trainers are generally highly skilled practitioners and should be able to modify their approach to match the situation.
The yards listed in the table below are some of those for whom the first run is typically a sighter; whether things will be different in 2020, time will tell, but it seems prudent to be cautious until evidence to the contrary manifests itself.
It is certainly the case that the performance of runners from these yards after an absence is not meeting market expectation with unhealthy A/E numbers across the board. Again, the table is restricted to runners at 20/1 or shorter (SP), and 100 runners is required to qualify.
In broad terms, unless there is a compelling reason not to, it’s a straightforward decision to pass on entrants from these guys after a hiatus. Naturally, Easterby (Tim) is on here as intimated earlier. It is going to be fascinating to see whether these yards will still be content to play the long game once racing is back.
Personally, I’m not sure how to play things yet. The timing of the resumption will be key in shaping a strategy. With the deferral of four of the Classics it’s looking more and more likely that the resumption date will be mid-summer. Given that, my gut feel is that angle and data-driven wagering of this kind will be fraught with danger. However, where there is a market there will always be an opportunity to find an edge.
One thing is for sure: one of my starting points will be to man-mark the yards in this article when we get going again. By spotting the trainers who are ready to go, or otherwise, there should be plenty of chances to make up for lost time. Who knows, I may even be backing Tim Easterby horses after a prolonged absence. These are strange times, after all!
Stay safe.
- JS
https://www.geegeez.co.uk/wp-content/uploads/2020/04/rogervarian.jpg319830Jonny11https://www.geegeez.co.uk/wp-content/uploads/2022/10/geegeez_banner_new_170x78.pngJonny112020-04-17 06:06:312020-04-17 06:55:45Jon Shenton: Who to Layoff?
After reading the responses from last week's SotD overview and also checking that I wasn't duplicating anyone else's work, I'm going to kick off my series of research pieces with a fairly simple analysis of trainers to follow on the Flat with their 2 yr old debutants, writes Chris Worrall.
And the way I've approached this ahead of the 2020 season, which will hopefully be here as soon as it's safe to do so, is to look back over the previous four seasons to get a five year overview by the end of this season. With that in mind, I then applied the following criteria to the long list of trainers with such runners since 2016...
a minimum of 30 2yo debutants
a minimum strike rate of 10%
an A/E above 1.00
profit over the four years at Betfair SP
and profitable in at least three of the four years
Applying those filters reduces the list to a far more manageable six trainers:
Paul Cole, Richard Fahey, Jessica Harrington, Eve Johnson Houghton, Ger Lyons and David Simcock
Their collective figures, pulled from the excellent horseracebase.com, over the last four seasons look like this...
A near 15% strike rate and an ROI at Betfair SP in excess of 50% is something we can really work with, even if replicating that stratospheric level may be nigh on impossible.
The yearly breakdown since 2016 looks something (well, exactly) like this...
As you can see, 2018 wasn't quite as good for our highlighted trainers, but still profitable nonetheless. That said, the strike rate, which dipped below 10%, would have tested confidence.
We can further break down the data so see which trainers performed best in each year or, conversely, which years were best for each trainer which would lead us ultimately to the same end point.
What I can tell you from that breakdown is that runners trained by Cole, Fahey and Harrington were profitable at Betfair SP [the P/L(BF) column in the tables] in each of the four seasons.
Ger Lyons had a tough 2016, but has shown three years of unbroken profit since; and Eve Johnson Houghton's numbers dipped in 2018, when she went 0 from 15 with juvenile first-timers, but are otherwise solid.
But I'd have reservations about David Simcock in this context after he went 0 from 20 in 2019: if we were to drop one of our six trainers, it would likely be him.
Figures for 2016...
And 2017...
With 2018 producing...
And finally 2019 gave us...
From the above annual break down figures, Paul Cole's failure to hit the 10% SR in both 2017 & 2018, and Eve Johnson Houghton's similar strike rate deficiency in 2018 and 2019 ought to preclude them from our final angle; and if we also decided that David Simcock's 2019 performance was too unsettling for inclusion, we'd then take just three trainers forward: Fahey, Harrington and Lyons.
I'm happy to overlook Ger Lyons' failure to make profit in 2016, as a near 16% strike rate suggests his winners were simply too short-priced to cover the losers. If we set 2016 aside for now, our three final trainers' collective record over the past three seasons stands at a combined...
...which is not too dissimilar to our opening set of figures. The strike rate has risen slightly from 14.56% to 15.38% whilst the ROI has dropped from 50.13% to a still very respectable 43.29% and, importantly, I think the final numbers are likely to be more stable with less scope for variance.
So, if you're looking to blindly back 2 yr olds on their Flat debut this season I'd suggest your starting point should be those trained by Richard Fahey, Jessica Harrington and Ger Lyons.
I intend to back up this starter piece with a more detailed analysis of each of my six originally highlighted trainers to analyse which of their two-year-old debutants to back based on criteria such as track/track location, going, distance, jockey, time of year and so on.
- CW
https://www.geegeez.co.uk/wp-content/uploads/2018/05/GerLyons_QatarRacing.jpg320826Chris Worrallhttps://www.geegeez.co.uk/wp-content/uploads/2022/10/geegeez_banner_new_170x78.pngChris Worrall2020-04-15 15:29:512020-04-16 11:28:16Two-year-old Flat Debutants, Part 1: Trainers
Another day, another dataset. Well, you've got to do something to pass the time, haven't you? I was thinking about how the National Hunt season 2019/20 ended so abruptly and how unsatisfactory it was; and then I began to think how unsatisfactory the whole Trainers' Championship is, to this scribe at least. Without for a second wishing to discredit the excellent Nicky Henderson, or his closest pursuer, Paul Nicholls, the barometer of success in this championship immediately discriminates against more than 99.72% of trainers (two with a chance, 716 others last season with varying degrees of no chance).
It is perfectly reasonable to assume that huge swathes of the majority have no desire to become Champion Trainer, but it is also fair to suggest there are scores of better than capable handlers who will never get the chance at the top table because of the self-perpetuating nature of its ranking system. A focus on volume and prize money rewards those with large yards full of expensive purchases; and how do you get such a cup which runneth over? By being atop the trainers' table.
Of course, everyone started somewhere and (most of) the names at the peak of the pile earned their place. Others further down the current list will one day join them and someone will wrest the crown from the districts of Seven Barrows and Ditcheat one of these days - for the first time since 2004/5. That season saw the last of Martin Pipe's 15 titles, interspersed mid-flow by a brace for 'the Duke', David Nicholson, and preceded by a further brace for... Nicky Henderson (and a single for David Elsworth thanks almost exclusively to Desert Orchid's heroics). So it is that, since 1985, only five trainers have been Champion. Proprietary stuff.
Back to the start and, as I was saying, I got to thinking about "who is the best?", a question where the 'who' varies depending on the definition of 'best'.
The formal understanding is the one with the most prize money accrued. Although that is on one hand somewhat crass, on the other it does seem to allow the cream to rise to the top - certainly in terms of quality and quantity. Both quality and quantity, however, are self-perpetuating functions of seniority: earned or otherwise, the answer is generally pretty much the same from year to year to year, which tells us little about the aspirants or the quietly very effective.
So I had an itch and I scratched it with a dataset. Not literally, of course.
Here's what I did next...
Because I wanted the findings to be vaguely meaningful, notwithstanding that they would be subject to conjecture, I looked only at trainers who sent out 100 or more runners in the 2019/20 UK NH season. From 718 to saddle at least one, that left a more workable number of 73.
And because I wanted, without ignoring the scale and class aspects, to partially normalise their overwhelming effect, I came up with some other (readily available) ranking factors. The factors I landed on appertained to betting and owner utility as well as the numbers game which completely besieges many trainers' thoughts from May to April each year.
For scale, I used runs, wins and places.
For owner utility - beyond the above - I selected earnings per run, winners to runners, win percentage and place percentage.
And for punter utility, I opted for starting price profit/loss.
There would be strong cases for a raft of other variables as well as, or in place of, those chosen; but this is my theoretical exercise and I hope the ones to have made the cut are at least reasonable.
So, against these eight measures, who is the champion trainer? Patience is a virtue. Let us first consider the best in each category.
Champion Scale Trainer
There is, for any conditioner of pedigree, a correlation between the number of runs and the number of wins/places: more runs will bring more wins and places. Simples.
Most Runners
Dan Skelton has a peerless propensity for volume. Last season he saddled over 250 more runners than the next on the list, Donald McCain. McCain's own scale speaks, well, volumes about his Lazarus-like comeback from the sudden loss of his major owners, Paul and Clare Rooney, less than five years ago. That split allegedly involved at least 60 horses, 52 of which had run in the previous season; so credit to McCain for rebuilding so rapidly.
Always keeping close tabs on each other, in third and fourth, are the titans Nicky Henderson and Paul Nicholls, with Messrs. Jonjo O'Neill, Evan Williams and Nigel Twiston-Davies rounding out the least secret seven in the sport.
The final trio in the top ten, and the only other three to send out more than 400 runners in the 2019/20 season, were Philip Hobbs, himself resurgent after a season in the doldrums two back; Colin Tizzard, and Neil Mulholland.
They've got the quantity, but how many winners came their way?
Most Winners
Unlike the Trainers' Championship, decided by prize money won, the Jockeys' Championship uses this metric: number of winners. If trainers were calibrated on the same gauge, would the winner still have been Nicky Henderson? Yes! And no...
Tied at the summit are the actual Champion Trainer, Henderson, and the Most Runners award winner, Dan Skelton. It seems quite fitting that there should be a confluence of quality and quantity between this pair that brings them together with the exact same number of victories - 118 - across the season.
No other trainer managed three figures, though of course the truncation of term almost certainly denied that noted fast finisher, Paul Nicholls, who might yet have inflicted some squeaky bum time on his nemesis through potent late salvos at Ayr and Sandown.
No Duckworth-Lewis here, result stands, weighed in.
Familiar names all completing the top ten, and some performances worthy of mention. Philip Hobbs' return to form was expected, perhaps, but the re-emergence of fellow Somerset resident David Pipe was probably less predictable. From 116 winners in 2014/15, Pipe contracted to 80 then 59 then 33 in the following three seasons. 44 was an improvement last term and, from a handful less runners this campaign, the most famous resident of Wellington boot-ed home 66 winners, an uplift of 50%.
Pipe was joined in the swinging 60's by Olly Murphy and Fergal O'Brien as well as the already mentioned McCain, Tizzard and O'Neill. Dr Richard Newland, much of whose work is conducted in the summer months, has a tough gig to replicate last season's sixty winners given jump racing is not mooted to return until at least July 1st. Others - indeed most - will be affected by that, too, though few target the summer programme as effectively as the Doctor.
Most Placed Horses (including winners)
The same top four as the most winners chart, but Fergal O'Brien gets a second name check, jumping into the top five for number of placed horses.
Given he was only 16th in terms of number of runners saddled, both his win and place counts are commendable.
And the Champion Scale Trainer is...
Congratulations go to Mister Big, Dan Skelton.
Top for number of runners, joint-top for number of winners, and top for number of placed runners makes Dan the runaway winner of this category.
Skelton was flanked on the podium by Nicky Henderson and Paul Nicholls, his former boss, who this time settled for silver and bronze respectively.
There were no major surprises lower down the scale top ten with the probable exception of David Pipe. After some regressive and lean years, it's great to see Nicholashayne back on the map.
*
Champion Owner Utility Trainer
The first category is arguably a touch superficial in some regards, so well done if you've made it this far! In my opinion, things are about to get a lot more interesting, even if that may only be relative...
There are four sub-categories that together will earn one trainer the gong for owner utility, a considerably more meaningful stripe upon any handler's shoulder. To remind you, the quartet are earnings per run, winners to runners, win percentage and place percentage.
Highest Earnings Per Run
Had I used earnings, as well as number of runs, wins and places, the overall table would have looked quite similar to the actual Champion Trainer table: that would have been self-defeating. But, by the same token, it is appropriate to consider earnings, in context.
So I took the seasonal prize money totals of our trainers and divided them by their respective number of runners. A great leveller.
As can be seen, that puts a whole different spin on proceedings. That scourge of the British Cheltenham Festival trainer ranks, Gordon Elliott, heads the list, and by daylight, too.
Elliott's Cotswold squad snaffled seven winners through the season, which was four fewer than his northern raiders purloined: always a happy hunting ground, Perth provided aplenty, accounting for 11 of Cullentra Stables' 28 UK 2019/20 wins.
Then follow NJH and PFN, at a respectful distance, as was often the case in mid-March (seems a very long time ago now).
But emerging from the long grass are some lesser lights able to compete better than equally with most on this more even sward.
Anthony Honeyball, whose yard is sponsored by geegeez.co.uk; Brian Ellison, another renaissance man this season; and Harry Whittington, propelled into the top eight thanks to the likes of Festival winner Simply The Betts and, in the same Brooks family ownership, Rouge Vif and Saint Calvados, all provided plenty of bang for their owners' bucks.
In the cases of Ellison and Honeyball, it is likely that initial purchase prices were significantly lower than the top three as well as Harry W. Further credit then is due.
Winners to Runners
If you're an owner, what do you crave more than anything else? To see your horse win. Ideally a big pot but, once reality kicks in, any pot will do. So who managed to make connections smile on the most regular basis?
Given that all of the trainers in the list sent out at least 100 runners, this is a representative table of those whose focus may be said to be on quality - at least race-winning quality somewhere on the ability spectrum - over quantity. It is also a nod to a handler's ability to place horses in the right races. To appear in this top ten anywhere is a huge credit.
For example, the likes of Paul Nicholls and Nicky Henderson can be marked up for their four-in-nine winners to runners ratios given the previously flagged scale of their operations. Dan Skelton, by comparison, comes in at number 21 with a slightly better than one-in-three winners to runners rate. That's respectable, especially given he saddled 212 individual horses last season; but it's not at the level of these guys on this measure.
Four trainers managed to win with more than half of all the horses they sent to the races, headed by Anthony Honeyball whose owners cheered their horses to victory at least once during the season slightly more often than four-in-seven. What makes this performance even more creditable is that Honeyball had a dismal campaign in 2018/19, when the yard was blighted by a stubborn virus for most of the year.
A close second was the revitalised Brian Ellison. What is remarkable about Ellison's season is not the number of winners - he recorded the same 34 total two seasons ago, and prior to that was in the high forties for two further seasons; no, it is the strikingly fewer runners which he sent out. It's a stark illustration, perhaps, of how fashion changes but consider that Ellison's 34 NH winners in the 2017/18 campaign came from 249 runs and 65 different horses whereas he matched the winner tally from just 117 runs and just 37 individual horses this time around.
Borders trainer Sandy Thomson and Grand National-winning summer specialist Dr Richard Newland keep their connections contented at a better that one-in-two rate, too.
All of the other handlers in the list - David Pipe, Chris Gordon, Fergal O'Brien and Olly Murphy - deserve mention for their excellent performance on this important measure of utility.
Win Percentage
There is, perhaps unsurprisingly though statistically not necessarily, a strong link between the winners to runners key players and those with the highest win percentage based on wins to runs. To be clear, whereas winners to runners measures how many individual horses won during the season, win percentage is simply the number of all wins divided by the number of all runs.
The top pair, clear of their field, were again Brian Ellison and Anthony Honeyball, though in the reverse order this time. Both won at about 29% during the season, both recorded Impact Value scores around 2.5 (implying they won almost two-and-a-half times as often as the average in the training ranks).
Henderson's one-in-four win rate, on quadruple the number of runners as the top two, is also very impressive. No other National Hunt trainer of more than a hundred runners last term managed an IV of greater than 2, Jamie Snowdon's next best being 1.89.
To put those win strike rates into perspective, the average for all trainers last season was 11.79%.
Place Percentage
If your horse cannot win a race, what is the next best thing? It is probably being placed.
There should be a link between win percentage and place percentage, though the latter often 'smooths the curve' on the basis that more horses make the frame than win and, therefore, the sample size is bigger.
There are new names in this top ten, though not the main man. He is Anthony Honeyball, whose consistency in the Owner Utility category cannot be overstated. Honeyball's Potwell Farm team made the frame more than half the time last season, the only trainer in the country to achieve that from greater than 100 runners.
Gordon Elliott's selective sailers came in next best (consider that Elliott ran 292 individual horses in Ireland last season, 80 more than did Dan Skelton in the UK, and you'll start to get a feel for the squad from which he can cherry-pick his raiding party) at just shy of 50%, with Fergal O'Brien a close third.
Brian Ellison, top for win strike rate, drops to fifth here, while Seven Barrows and Ditcheat, as well as Olly Murphy's Warren Chase Stables, are all again represented in the top eight.
New names to feature here, suggesting they may have been a touch unfortunate not to win a couple more last term, are Kim Bailey and Alex Hales.
And the Champion Owner Utility Trainer is...
Huge congratulations to Anthony Honeyball, whose average position of second, including two top rankings, across four sub-categories marks him down as a worthy winner of the Champion Owner Utility Trainer section.
To win with well over half of all horses, to make the frame with more than half of all runners, to win with two-in-seven of all runners, and to maintain sufficient quality whilst doing it to record the fourth-highest earnings per run is outstanding. Honeyball is clearly the boutique trainer in the country and it is not coincidence that geegeez.co.uk both sponsors the yard and syndicates horses within it.
Nicky Henderson again must settle for minor honours, third place this time behind the resurgent Brian Ellison in second. Paul Nicholls further demonstrates his consistency in fourth, though he might have snatched bronze had he been afforded the chance to reprise the late flourish of recent seasons in the final weeks of term.
Dr Newland, Fergal O'Brien, David Pipe, Olly Murphy (the only other trainer with whom geegeez.co.uk syndicates jumpers), Philip Hobbs and the hitherto unmentioned Nicky Richards complete the top ten. All performed impressively for their owners during the 2019/20 campaign.
*
Champion Bettor Utility Trainer
Just one category here, starting price profit/loss (SP P/L). For this pilot ranking piece, that will suffice as representative of punter utility, but it will likely be supplanted in future by something like exchange A/E, a more predictive metric performed on a truer market. That's for next time.
Profit/Loss at Starting Price
Isn't it funny how the minute one puts a bettors' slant on things the picture changes almost completely? Funny yes, but it also makes perfect sense. Those at the head of the official Champion Trainer table will almost always be the best known of their peer group, most of them relative household names to even casual bettors. That's precisely why they won't generally appear in this list: they are over-exposed from a betting perspective, though all will saddle great value bets in certain situations. That's for another day!
Brian Ellison's preeminence in this collective is a nod to his struggles in recent seasons. This is a guy who has achieved a Grade 1 and eight Grade 2 victories under National Hunt rules, all bar one of those since 2015. And yet his overall regression in recent times, highlighted above, has led to some juicy priced winners - and a +56.03 level stakes profit - as a result of a consistent run of form insufficiently accommodated by the market.
Last season's exchange Actual over Expected (Ex A/E) of 1.55 is likely not sustainable - and is a sore thumb when compared to his five season Ex A/E of 1.04. The latter figure remains solid enough, and it is to be hoped that 2019/20 was a turning point for a likeable man who is, clearly, a very, very good trainer.
In second place is Rebecca Menzies, like Ellison a dual-purpose trainer. +29.75 to level stakes will have been highly pleasing for yard devotees and, unlike the leader in this season, she also broke even last season. Ms Menzies has a two-year Ex A/E of 1.31.
The bronze position goes to Ben Pauling, which is remarkable when one considers that his team were badly out of form for a chunk of the campaign. Pauling is an under-rated trainer in my opinion, and he has some very promising horses for next term. With a clean bill of health, he should begin to challenge some of the more mainstream top tens.
Excellent punter performances, too, in the latter half of the top dozen from rankings regulars Honeyball, O'Brien and Pipe, who all remained in the black to level stakes at starting price.
Thus the Champion Bettor Utility Trainer is Brian Ellison. Ellison has had a brilliant season and this category award is fitting recognition of that.
*
Overall Top Ranked NH Trainer 2019/20
We've seen which handlers have performed best in terms of scale, and owner and punter value. Those are the constituent components that inform the overall rankings. There is no weighting, no magic algorithm to contrive an outcome. Arguments, perfectly credible ones at that, can be proffered about the validity of the chosen variables: isn't that the fundamental point - to be arguable - of a ranking or rating system? And, with those caveats in place, it is time to reveal the 2019/20 Geegeez Champion National Hunt Trainer.
The winner is...
NICKY HENDERSON
The master of Seven Barrows is the official Champion Trainer for the season just passed, and he is top ranked in the Geegeez list also. Having set out to create a level playing field for anyone who saddled 100+ runners in the campaign, I'm not entirely sure whether to laugh or cry at the fact that the final answer is the same as the deeply unsatisfactory - to me at least - method of awarding Champion Trainer honours.
Henderson can be a touch divisive, often projecting an aura of bumbling naivety in stark contrast to his long-term elite level performance. But that performance, matching quantity with quality, is just about peerless whichever way you dissect it. A level stakes profit at exchange prices in the last two seasons is the cherry on top of Henderson's impressively accomplished cake.
In second and third are Fergal O'Brien and David Pipe, the former consistently climbing the ranks, the latter back in the big time. Both had excellent campaigns by a number of measures and are applauded.
O'Brien went from a 12% to a 19.4% win rate, bettering his previous best of 18.35% in the 2016/17 season. He also recorded his best ever number of winners. Pipe has been mentioned numerous times in the above despatches, and rewarded numerous loyal and big-spending owners in 2019/20. He has some exciting novices to look forward to next term as well as his usual batch of interesting handicappers.
Very close to them - note in the full table below the left-hand average score column from which the rankings are produced - in fourth and fifth are Paul Nicholls and Dr Richard Newland. I suspect Nicholls' win percentage and earnings per run may have improved enough in a full season to bag third but that, as we know, is not how the cookie crumbled.
Given the loss of at least a sizeable chunk of the summer jumping this year due to the coronavirus hiatus and a focus on flat racing when the sport returns, it might be expected that while Nicholls could elevate to the podium, Dr N will do very well to hang on to his excellent top five finish.
In joint-sixth place are Anthony Honeyball and Nigel Twiston-Davies. Honeyball should have more horses/owners, his finishing position testament to the brilliant job he, Rachael and the team do with the small but select group in their care. Naturally, that would bring the challenge of maintaining performance levels on greater volume, but if there is a trainer in the top ten deserving of such a challenge it is him.
Twiston-Davies, meanwhile, had the lowest win and place strike rates of the top ten in spite of achieving his own best win rate since the 2007/8 season. A winners to runners ratio of 40% is perfectly respectable except when placed next to Honeyball's season-leading 57.5%. The latter, clear top in the Owner Utility section, has some very exciting novice hurdlers and chasers to work with next term, including two mares for geegeez.co.uk syndicates, one of which is already a Listed bumper winner.
In eighth place is Olly Murphy. Incredibly, Murphy is in just his third season training, and he's managed to marginally improve his win strike rate from season to season while scaling up in parallel. Overall runner numbers were down a touch this term, obviously due in large part to the lost six weeks caused by Covid-19, but this was a breakthrough cycle for the Wizard of Wilmcote as he recorded his first Grade 1 success with Itchy Feet in the Scilly Isles Novices' Chase. The Cheltenham Festival was frustrating but Olly has an exciting team of youngsters for next season and he looks very likely to continue his ascendance when jumping resumes.
It will be fascinating to see if Brian Ellison, in ninth, can sustain his effort into the new season. He has bundles of back class but recent struggles and a group of horses that may be handicapped towards the upper end of their ability means he'll probably need to acquire new stock to stay competitive in the rankings. I hope he does.
The likes of Philip Hobbs, Dan Skelton and Nicky Richards are all bubbling under, though Colin Tizzard's 15th place can be considered an underachievement. So too, to a lesser extent, can the rankings of Jonjo O'Neill and Donald McCain: given the firepower they have, earnings per run of around £1,250 are disappointing.
The full table is below so you can look for your favourites and see how they fared. Click the images (two halves) to enlarge them.
I'd very much welcome any comments and suggestions, on the process rather than the results - data are data, after all.
In a recent article I combined my draw bias roots with a more recently acquired interest in pace / running styles to overview their collective impact at Pontefract, writes Dave Renham. This time I am going to look at another northern racecourse, York.
A picturesque Grade 1 track, York stands in the south west of the city on the Knavesmire. The racecourse is around two miles in length in the shape of what resembles a 'U', and it has a long run-in of nearly five furlongs. Over the sprint distances of five and six furlongs they race on a straight course; the seven-furlong distance starts from a ‘spur’ or chute and they do race around the tangent of the home bend; from a mile upwards they race on the round course. The 1m 6f distance starts with a two-furlong chute at the end of the back straight before they join the main course.
York has always been considered to be a fair track and when I was studying draw bias ‘24/7’ back in the late 1990's and early 2000's the mile trip offered a decent low bias but, other than that, there was little to report. The sprint trips in those days looked very even with little difference from wing to wing. However, I have noticed more recently that a sprint draw bias may have started to appear so I am hoping the stats back that perception up.
York Racecourse map
For this article, as with the Pontefract one, I am using tools available on this site, namely the Draw Analyser, Pace Analyser and the Query Tool. The initial period of study is a long one, going back to 2009, but I will examine more recent data (2015 to 2019) in detail, too, where appropriate. I will also check other variables including ground conditions and will focus once again on eight-plus runner handicaps only.
From a draw perspective, when analysing each handicap race, I divide the draw into three sections (low, middle, high). This how the Geegeez Draw Analyser does it and has always been my favoured method, too. In this way, a ten-runner race has three low stalls, four middle stalls and three high stalls; an eleven-runner race has four low, three middle and four high; twelve-runner races have four low, four middle, four high; and so on.
It should also be noted that I also adjust the draw positions when there are non-runners. For example, if the horse drawn 6 is a non-runner, then the horse drawn 7 becomes drawn 6, draw 8 becomes 7, and so on.
The differences in the percentages will help to determine the strength of the bias and, given a level playing field, one would expect the win percentages to be around 33% for each third. The more races in a sample the better: that may sound obvious, but with any data set, especially the type of small ones in which racing must habitually deal, there is an element of randomness.
Since 2009, the period under review, there have been 105 qualifying eight-plus runner five-furlong handicap races. I have also included races over 5 1/2 furlongs of which there of which there were 21. Here are the overall draw splits:
These figures suggest a modest low draw bias over the longer term. The A/E values below back up this theory from a betting perspective:
For the record, if you had bet every horse from the bottom third of the draw at £1 per bet you would have roughly broken even – a loss to SP of 50 pence over 523 bets to be precise! [And, though it's not the main measure in this article, blindly backing those in the bottom quarter of the draw would have netted a £55.50 profit at SP!
Time to look at each individual draw position broken down:
Draws 2, 4 and 5 have made a profit to SP and all have A/E values above 1.00 again indicating a low draw edge. It is time to look at some more recent data; for this I will focus on the last five seasons (2015-2019). Here are the win percentages for each third over this more recent time span:
It is clear from these percentages that the low draw bias has strengthened in the last five years. These are the individual stall values:
Once again draws 2, 4 and 5 have proved to be profitable and if we combine the results of draws 1 to 5 they produce a positive overall A/E value of 1.09; compare this to draws 12 and above that combine for an A/E value of only 0.43. Low draws definitely have been in the ascendancy since 2015, although it should be said that the microcosm of 2019 was more even in terms of the draw.
It is unclear, having dug deeper, whether the going has any great significance. I cannot find a strong enough pattern to elaborate on and I don’t wish to further extend the article with relatively worthless stats as it is quite comprehensive as it is. Likewise the bias is consistent in terms of field size – low draws have had a similar edge in smaller fields of 8 to 10 as they have in bigger fields stretching across the track of, say, 17 runners or more.
Let us now look at pace and running styles. Here are the overall figures (2009-19) by early run style:
There is a clear edge for front runners here, a pace bias that seems marginally stronger on ground conditions of good or firmer. Looking only at big field (16+ runners) 5f handicaps, the IVs suggest a decent strengthening of the front running bias and a commensurately tougher time for hold up horses:
Now a look at draw / pace (running style) combinations for front runners in these 5f races:
For a straight course to see a single third of the draw (low) with an early leader figure of over 50% is unusual. Only Sandown over the straight 5f sees similar stats – the average % for all straight courses for low drawn runners taking the early lead is around 36%.
This 'early leader' by course table illustrates the point. (Note that a race can have more than one 'leader' where two or more horses contest closely).
You would expect 5f races around run a bend to have high figures like this for the bottom third leading early, as lower drawn runners should find it easier to get to the inside rail. But on the straight track at York, I cannot really explain the figures. Any suggestions welcome!
York 5f Handicaps (8+ runners) Summary
A low draw, ideally coupled with good early pace, or at least the ability to hold a position early, looks extremely important.
*
York 6 furlongs (8+ runner handicaps)
There have been 112 qualifying six-furlong races going back to 2009. Here are the overall draw splits:
The ten-year picture shows a very even split which does not correlate with the 5f stats, both distances being run on the same straight piste.
The A/E values are what one would expect given the win percentages, with no-brainer profit angles conspicuous by their absence:
A look again at individual draw positions and how they have fared over this time frame:
This table is a good example of how random draw data can actually be, and how individual draw positions often show this randomness. Stall 3 is a complete outlier with 15 wins and a £93 profit; in the context of neighbouring stalls there is no other explanation than that it's the confluence of happenstance in a small data set.
Given the ostensible long-term fairness of the six-furlong trip in terms of draw thirds, I wanted to see if there might be a draw bias when studying more recent handicap data at the distance. Here are the draw splits for 2014-2019 seasons where have been 51 qualifying races:
Interestingly, the recent data points to a very strong-looking low draw bias, with high draws having really struggled. When we split by draw we see confirmation of that in less ‘random’ looking data:
Draws 2 to 5 have all been profitable to SP and all have very positive A/E values. This adds confidence in terms of there being a robust bias.
Let us now look at A/E values in a slightly different way – I am going to split the data by draws 1 to 5, then 6 to 10 and finally 11 or higher:
This really accentuates the low draw edge and I am fairly confident this is a bias we can exploit when the season gets started again. Before I move on to pace data, I want to share with you the result of the last qualifying handicap race, run on 12th October 2019.
It was the Coral Sprint Trophy with 22 runners; the first eight finishing positions were drawn as follows: 1st (5), 2nd (4), 3rd (10), 4th (3), 5th (2), 6th (1), 7th (8) and 8th (7). Seven of the first eight home were drawn in single figures and all were drawn in the bottom half of the draw. For record the last five horses’ home (placed 18th to 22nd) were drawn 22, 19, 14, 17 and 18 respectively.
This race demonstrates how strong the bias can be. Now, not all races fit this pattern, and high draws will have their ‘day’, more than once, but in recent years it is clear that lower drawn horses have enjoyed a significant edge.
As with the 5f races, I found that the going makes little or no difference to the above. Field size does have a small effect, however, with large fields (17+) increasing the low draw win percentage slightly to 59%. However, with only 22 races included it is a limited sample.
Now a look at York 6f handicap (8+ runners) pace and running styles now. Here are the overall figures going back to 2009:
There is a really significant edge for front runners, much stronger than over 5f which is unusual. Normally, as the distance increases, the edge for front runners decreases. This pace bias has actually been even stronger in the last five years – front runners have won around 30% of all races from 2015 with an IV of a whopping 4.06 and an A/E value of 2.92.
Now a look at draw / pace (running style) combinations for front runners in 6f handicaps (2009 – 2019):
These are virtually a carbon copy of the 5f figures. Once again lower drawn horses lead far more than you would expect. Again, this is difficult to explain and unfortunately I can’t.
York 6f Handicaps (8+ runners) Summary
Six-furlong handicaps at York in recent years have strongly favoured lower drawn runners from a draw perspective. In addition front runners seem to have a very strong edge, too, and horses appear far more likely to lead if drawn low (though I am struggling to find a reason for this).
*
York 7 furlongs (8+ runner handicaps)
There have been 94 qualifying races over 7f. Remember this distance is run around part of the home bend starting from a chute:
Middle draws have had the highest percentage of winners but the figures in reality are quite even especially when I share that lower draws have the best win and placed combined record. Ultimately this looks a very fair C & D in terms of the draw. I think some people may have expected lower draws to have a slight edge but I am not sure the initial chute plays they some might imagine.
The A/E values do suggest though that for win purposes middle draws have offered some value during this 11 year period:
The last five seasons have seen a similar pattern with a fairly even playing field; again, middle draws have arguably fared best, winning around 44% of all races.
Let us now look at each individual draw and their stats since 2009:
A few stalls have proved profitable, but it is highly unlikely this will be replicated in the future as there is no real pattern to it. It is interesting to note that the very highest draws (16 to 20) have provided just 1 winner from 121 runners. Hence in big field contests it looks best to avoid those with 'car park' berths.
In terms of going it seems that higher draws struggle when the going gets on the easy side. On good to softer or softer the draw splits are as follows:
The A/E values for those same good to soft or softer races correlate thus:
It should be stated that there have been only 28 races on this softer type of going, far too small a sample about which to be completely confident. However, the win and placed stats are also very poor for higher draws suggesting that it is certainly possible that this trend towards low to middle will continue.
York as a course rarely gets soft or heavy and only eight qualifying races have been run on that going in the last 11 years. However, worth sharing is that of the 28 win and placed horses, only three came from high draws (11 from low, 14 from middle).
From a draw perspective then a middle draw maybe optimal with both middle and low readily preferable to high: higher draws seem to struggle on going softer than good, and very high draws struggle all the time.
Onto to pace and running styles now. Here are the overall stats:
Front runners have a very slight edge but ultimately there seems no strong pace angle here over 7f. As the ground softens it seems that front runners and horses that track the pace start to have more of an edge but, as mentioned above, the limited sample of 28 races on good to soft or softer would temper confidence in the figures.
Finally let us examine the draw / pace (running style) combinations for front runners in 7f handicaps:
Low draws are more likely to lead as they are closest to the inside, and therefore have least distance to travel around the part-bend. However, whilst I alluded to the starting chute may help lower draws, it may also be that occasionally horses not well away from low draws get snatched up on the inside as wider-drawn rivals attempt to cut the dogleg.
We can see from this draw/run style heat map, which shows place percentage for 8+ runner 7f York handicaps, that those drawn low and held up have the poorest place rate of the waited-with participants.
York 7f Handicaps (8+ runners) Summary
To conclude 7f seems to offer draw and pace punters no significant edge, though exercising caution around high draws may be prudent.
*
York 1 mile (8+ runner handicaps)
Onto the 1 mile trip – a distance at which I am hoping to see a relatively strong low draw bias as historically was the case during my 'draw fever' days. The configuration of the track, with a shortish run to two sharp left-hand bends in close proximity to each other. Horses trapped out wide can forfeit a lot of ground.
There have been 71 qualifying eight-plus runner mile handicaps going back to 2009:
The raw stats clearly favour lower drawn horses. Middle draws are next best and, in turn, have an edge over higher drawn horses who look to be quite disadvantaged. In spite of this quite well known - and indeed obvious when one looks at the course configuration - advantage, the A/E values help back up the raw win percentages and imply a small profit to be had from backing low draws indiscriminately:
This increases confidence in the bias.
Looking at the going the bias is less strong on very fast ground (good to firm or firmer), but on good ground or softer low draws have prevailed in 27 of the 45 races (SR 60%).
So to the individual draw data now:
Looking at the lowest six draws as a whole they paint a relatively strong picture. Clearly not all six stalls were going to be profitable but you only have to look at wins, strike rate and A/E values to see these figures are strong in terms of their grouping. Combining all these stalls would have seen a small 3p in the £ loss backing all 426 runners ‘blind’, and their combined A/E value is an impressive 1.15. Compare this to draws 7 to 12 whose A/E value is just 0.35 and where backing all runners ‘blind’ would have lost you over 61p in the £.
Focusing on more recent data to see whether the bias has been as strong over the past five seasons (2015-2019) remains a smart ploy. There have been 34 qualifying races giving the following draw stats:
These stats mirror the 11 year data so the inside bias seems as strong as ever. Below is the constituent draw data for those last five seasons:
Again stalls 1 to 6 are the group of stalls that we are drawn to (pardon the pun!). Their combined A/E value stands at 1.20 and you would have made a small profit backing all runners drawn 1 to 6 to the tune of 7p in the £.
For real system punters out there backing horses drawn 1 to 6 that were also in the top six in the betting would have yielded 22 winners from 111 runners for a profit of £46.96 (ROI +42.3). Now I am not personally an advocate of systems but this illustrates how some punters could theoretically have made money over this track and trip in recent years. There is enough logic supporting the angle to suggest it has at least a fighting chance of continuing to pay its way.
The going stats noted earlier in the 11 year data are essentially the same with the more recent data subset. 59% of races on good or softer ground have been won by the bottom third of the draw (low).
A look at the pace / running style figures in mile handicaps (8+ runners) next:
A small edge for front runners and generally the closer to the pace you are the better. Front runners seem to enjoy a stronger edge as the ground gets firmer as the following table shows:
Data is limited which we must take into account of course; that is why I have added the placed stats too, which support the general direction of travel.
So onto the draw performance for front runners in mile handicaps:
Higher draws lead less often as one might expect, but I am surprised middle drawn horses have led slightly more often than lower draws. Perhaps some jockeys have the desire to overcome an ostensibly poor middle stall by gunning from the gate; if that is true, it would make it commensurately more difficult for the widest riders to execute the same strategy.
The Draw Analyser image below shows - for qualifying races run on good or firmer ground - first a draw table by IV3 (average Impact Value of a stall and its immediate neighbours), and secondly, a draw/run style heat map by Impact Value (IV). The benefit of a low draw and or pace pressing early position is clear, as is the difficulty faced by wider drawn runners, especially if held up.
York 1 Mile Handicaps (8+ runners) Summary
The mile trip shows a strong low draw bias and, from a punting perspective, it gives us a potential edge. This is underscored by very strong A/E values. The betting market has not taken the bias fully into account yet, and long may that continue!
*
York 1 mile 1 furlong (8+ runner handicaps)
The final distance I wish to look at, but only briefly as there have been just 26 qualifying races in the last 11 years. With data so limited I am simply going to share the very basic stats. Here are the draw splits:
Low draws seem to have a very strong edge. My guess is that it would not be this strong with a much bigger sample of races, but as the distance is only a furlong more than the mile races we just reviewed, one would expect low draws to still comfortably hold sway. Here are the A/E values:
These correlate with the draw percentages as one might expect. For the record, stall 3 has provided ten of the 26 winners!
Pace wise, only two of the 26 races have been won by front runners with an A/E value of 0.93. Prominent racers have enjoyed the most success from the small data set and have won 13 races with an A/E of 1.55.
For the record, and mindful that there are just 26 races in this data set, here is the draw/pace heat map by place percentage:
York 1m1f Handicaps (8+ runners) Summary
I think it may make sense to group this distance with the 1 mile data in the future, but low draws and a prominent run style looks optimal, albeit from an unreasonably small sample of races.
*
York Draw / Pace Summary
In summary, York is a course where the draw clearly has a role: knowing where these biases potentially exist ought to help us with our battle to make long-term profit.
Pace wise, the sprint distances of 5f and 6f appear to offer a solid front running edge, especially when combined with a low draw.
And at a mile and nine furlongs, the value of being draw away from the outside, ideally close to the inner, should not be understated.
Hopefully you have found this article useful; now it’s time to look at the next course!
- Dave
https://www.geegeez.co.uk/wp-content/uploads/2018/05/york_racecourse-1.jpg320826Dave Renhamhttps://www.geegeez.co.uk/wp-content/uploads/2022/10/geegeez_banner_new_170x78.pngDave Renham2020-04-13 12:55:012021-08-10 14:11:25York Racecourse: Draw & Pace Bias
Four weeks in and I don’t know about you, but it’s almost impossible to tell the days apart, writes Tony Stafford. I know I’m writing this on what they tell me is Easter Sunday; but with little varying day to day – even the weather, with the sun blazing incessantly and perma-warm temperatures – what we have had is a totally homogenised month.
The initial shopping frenzy has cooled. I act as driver for our once-a-week taxi journey a few miles to the usual supermarket where I stay secure in the car with the windows firmly closed while Mrs S does the six-foot-apart car park snake towards the entrance. Inside, she assures me, she scrupulously adheres to the one-way arrows on the floor and reckons she’s almost the only shopper who does. Food is available now and thousands have died as we proceed in our frozen state.
The Racing Post, predictably and understandably, has been forced to reduce the size of its daily computer newspaper usually to eight pages, so I’ve no idea if the birthdays remain available. For my part I just have a quick squint before looking elsewhere.
I mention birthdays because Easter Sunday would have been the 100th birthday of my father had he not died 18 years ago. For years I regretted he had never seen the development of the Olympic Park, part of his home turf for all his life, apart from the six years he had to give up to join in the Second World War, which he spent mostly in Egypt. Not only did he not see the Olympics, he never knew they were coming. My mum was still alive and I can still picture sitting with her as the announcement that the Games had been won and would be staged in London in 2012 was broadcast to the nation.
Dad took me racing, to Arsenal and to the Oval as a kid, three pastimes that have never wavered in my interest. His principal goal in life seemed to be to ensure that I joined Eton Manor boys sports club as soon as I could, which meant on my 14th birthday.
Sixty years on, we took our permitted walk on Saturday with a puffing Yorkshire terrier, close to the River Lea, on the same land where I’d played so much of my cricket as a kid. I had even contrived to play in a match there rather than watch the World Cup Final in 1966, three years after – between innings – watching the famous Irish Derby when Relko, the runaway Derby winner, had to be withdrawn lame a few minutes before the start. That left the nine-length Epsom third Ragusa to step up.
Working for the racing press led me to so many places and a great deal of the more unlikely connections came from making summer trips to Kentucky when Keeneland still had the July Selected Yearling sale. In the late 1980’s I’d bumped into the former teen idol David Cassidy there, so when on Friday I noticed that an hour and a half documentary was to air promising the last recordings of the life that ended aged 67 three years ago, it was required viewing.
The all-encompassing years when his role in the antiseptic TV show The Partridge Family, which led to his becoming the most-worshipped pop star of the early 1970’s, were already way behind him. He got into racing and breeding and a couple of times we happened to be in the same company at dinner in the famed Dudley’s restaurant in downtown Lexington.
Then at Epsom on Derby Day 1987, I noticed someone in morning dress looking over at me. It was David, and he said he recognised me from Kentucky and asked where could he get a good view of the big race? It was the days of the old Epsom grandstand – two structures ago! -and I said I could sneak him up to the top of the Press stand.
As an American, he got a great thrill seeing his compatriot and friend Steve Cauthen coming home clear on Henry Cecil’s all-the-way winner Reference Point. Cassidy was in London that summer having taken over the leading role originally played in the West End by Cliff Richard in the musical, Time. He invited the family to see the show and asked the five of us backstage to his dressing room afterwards. He seemed a very nice chap and it was salutary to discover from the documentary the problems he had with his own father, the film star and famous tenor, Jack Cassidy.
Even more devastating was the evidence of his dementia, which as he honestly and perhaps possibly for the first time in his life, stated in interviews was caused by alcoholism.
Mortality is being brought home to us every day right now. One person whose recovery from coronavirus was revealed recently was Sir Kenny Dalglish, who shares a birthday with me. It’s so random who will be struck down next, you just have to keep out of harm’s way as much as you can.
Racing is going on in a few selected areas around the world under strictly-controlled circumstances, and two people who have been delighted that Australia has kept going are William Haggas and Tom Marquand. On Saturday at Randwick, taking advantage of the retirement of Winx, winner of the previous three runnings, they stepped up to win the Queen Elizabeth Cup with Addeybb by almost three lengths from Verry Elleegant. The near £700,000 first prize will no doubt have been causing envious glances from their training and riding counterparts around the UK.
Addeybb was following up his victory in another Group 1 10-furong race at Rosehill last month when he beat Verry Elleegant by only half a length. Forty minutes before the Queen Elizabeth Cup, the pair teamed up with recent Australian Group 3 winner Young Rascal, the 19-10 favourite for the two-mile Sydney Cup. Young Rascal disappointed, finishing unplaced and well behind former stable-companion Raheen House, who was a close third a week after winning a 50k prep race over the same track.
I see from the now long list of owners that Lew Day, who originally bought the six-year-old as a yearling on the advice of Sam Sangster and his first trainer Brian Meehan, still has his name as part of the syndicate. I’m delighted that he will have picked up a few pounds, or rather Aussie dollars, from his now far-away involvement.
On the same card, another well-known name, Con Te Partira, a winner at Royal Ascot for the Wesley Ward stable in 2017, collected a big prize for mares, the Group 1 Coolmore Legacy Stakes. The daughter of Scat Daddy was winning her third race for the Gai Waterhouse stable and will be worth a fortune when she eventually goes to stud. What price Royal Ascot, even behind closed doors, this year?
- TS
https://www.geegeez.co.uk/wp-content/uploads/2020/04/ReferencePoint_1987Derby.jpg320830Tony Staffordhttps://www.geegeez.co.uk/wp-content/uploads/2022/10/geegeez_banner_new_170x78.pngTony Stafford2020-04-13 06:58:402020-04-13 09:42:43Monday Musings: The Month Long Day
Race-reading was the theme here last time, and I’m going to return to it now having gotten the chance to go through the replays from the most recent Cheltenham Festival in full, writes Tony Keenan. A period without live racing has meant ample time to burrow into those races that are often deep, with even those running down the field quite conceivably posting career-bests.
Rather than focus on the obvious ones – not that there is anything wrong with that – I have tried to find horses that probably shaped better than the result while at the same time finished out of the frame (with one exception), mixing in their previous form to suggest reasons they may be interesting in the future. I apologise in advance to UK-centric punters as there is a distinct Irish lean with these eight horses. I have my own reasons for that!
Heaven Help Us – 7th Supreme Novices’ Hurdle
Anything that could go wrong for Heaven Help Us in the Supreme, did. Having had a decent early position chasing the pace, she made slight errors at the first two hurdles and was soon back in midfield before getting squeezed out at the third as Shishkin made his error, forcing her into the rear of the field.
Switched wide after that, perhaps to get a clear sight of the her hurdles as she had not jumped well, she was going fine heading down the hill only to twice find herself as the last domino in the Asterion Forlonge demolition derby, hampered at both two and three out as that one jumped markedly right losing all chance.
Having been tenth at the second last, she ran on well to take seventh and likely would have posted a career-best but for everything that went against her, a fine effort for one of the rags of the field, sent off with a Betfair SP of 399.
Her Christmas form when second to Abacadabras, having looked false at the time, reads much better now and she made her effort earlier than ideal then too, so she must be interesting for minor graded hurdles for mares at least.
Mitchouka – 6th Novice Handicap Chase
The whatever-it’s-called-now novice handicap chase was run in a good time which usually means there are some good horses down the field aside from the winner and runner-up who pulled clear, and Mitchouka might be one of those.
Having settled in midfield early on, he made a mistake at the first down the back which forced him to the rear of the field after which his jumping was none too quick. Still at the back of the main pack three out, he ran on well to take sixth, passing a host of rivals in the straight.
This is a bit of a bet on the trainer who, despite running very few horses (basically a private handler for Chris Jones), has shown himself a capable operator this season. Mitchouka had lost his way with Gordon Elliott and Gigginstown with very few signs of life year before joining this yard.
There have been others too, Cedarwood Road brought along nicely to win a listed novice last time and now looks set up for a good time novice chasing next season; while recent Ulster National winner Space Cadet might have been best of all. He had been without a win under rules since October 2016 before that.
Birchdale – 8th Coral Cup
Being in front – or even close to it – early on is typically the last place horses want to be in races like the Coral Cup where it usually pays to be delivered late; but this year’s race was unusual in that most of the main players were either up with the pace or not far off it as the gallop was surprisingly ordinary.
Cracking Smart did well to take fourth having raced in rear but his overall profile and often lazy run style mean he’s hardly one to follow while another of the hold-up horses, the sixth Bachasson, already managed to sneak a win in before lockdown commenced.
Most interesting of all might be the eighth, Birchdale, who did well to finish so close given where he started his run from. He had hardly had the ideal prep for this race either with this being his first start since running over fences the previous November.
A slowly-run two-and-a-half miles was hardly his optimum conditions either with connections viewing him as a three-miler last season (sent off 6/1 for the Albert Bartlett) and he retains lots of potential after just five career runs.
Gealach – 8th Fred Winter
It is hard to believe that it took until New Year’s Eve for Gordon Elliott to have a juvenile hurdle winner and he had been 0/30 with only two places to that point. Fast forward to the Fred Winter where he went one-three-four-eight-nine – it is almost as if there was a plan!
That initial winner was Gealach at Punchestown and he might be the one to take from the Fred Winter, allowing that there were reasons to be positive about the other Elliott runners too, not least Recent Revelations.
Coming into race off a 60-day break, he was awkward at the third and generally struggled with the pace throughout, inclined to be on and off the bridle. But he was moving into contention before a vital error three out put him in behind horses, sub-optimal for a horse that lacks gears.
From there he stayed on well to take eighth, beaten less than six lengths, and given his best flat form was over 12 furlongs-plus, there should be more to come from him up in trip.
Eskylane – 5th Champion Bumper
The standing start looked against Eskylane as Davy Russell wanted to be handy; but his mount was a bit slowly into stride and then got shuffled back early. The six-year-old fairly powered through the race thereafter (as is his wont) and looked a threat to all out wide early in the straight, hitting 2/1 in running.
The final effort wasn’t quite there but he travelled as well as anything before eventually finishing fifth (beaten a neck and a head for third) and it is possible his keen-going ways will be curbed a little when going hurdling; Felix Desjy and Abacadabras (both Grade 1 winners as novice hurdlers) raced freely in this race for the same yard in previous seasons.
This looked a strong running of the Champion Bumper and produced a good time while Eskylane’s previous form reads well too; he was only beaten by the now 141-rated hurdler Assemble on racecourse debut, with Appreciate It in third; while the fourth and fifth from the race have both won their maiden hurdles since.
Intriguingly, the race, run at Fairyhouse, was a memorial contest for Gordon Elliott’s uncle Willie Elliott, so it would have been one that the trainer was keen to win.
Tornado Flyer – 5th Marsh Novices’ Chase
It is rare that Willie Mullins runs his horses in the wrong races at Cheltenham but there is a suspicion he left a win or two on the table with his middle-distance and staying novice chasers this time around; in my eyes, Allaho and Easy Game should have been in the Marsh while Faugheen and Tornado Flyer would have been better off in the RSA.
The last of those doesn’t have the profile of some of the others but has only run two bad races in his life (bizarrely, at the same early-January meeting at Naas, a year apart) and has looked all about stamina since winning an attritionally-run Punchestown Champion Bumper in 2018.
He looked ill-suited by the moderate gallop of the Marsh, not helping himself by jumping badly, but even so did well to go from tenth turning in to a strong-finishing fifth at the line. Three miles looks his thing though we will have to wait until next season to find out if that is the case.
Embittered – 3rd County Hurdle
Strictly speaking, Moon Over Germany was the big eye-catcher in the County, Rachael Blackmore sending him to the front two out which looked a premature move; but he doesn’t entirely convince with his attitude (awkward head carriage here) and Embittered – who had been up there throughout and fought off that rival before the last – seems a more solid option.
Winning a Festival handicap hurdle from the front tends to be difficult but Embittered was good enough to hang on for third despite this. The performance also hinted at abundant stamina: there is a suspicion that despite spending his whole career to date at two miles, he is one that will be better over further.
I am no great judge of this but Timeform say he is a chasing type, which is likely where he is headed next year, while he also comes from the strongest novice hurdle form line of the season having finished fifth to Envoi Allen in the Royal Bond.
The Wolf – 7th Albert Bartlett
Though the complete rag of the Albert Bartlett field when sent off at a Betfair SP of 339, The Wolf didn’t shape that way at all and deserved to finish a bit closer.
Held up near last in a slowly-run race and trapped wide the entire way, he was starting to make a move two out where he made a mistake before rallying well in the straight and passing four rivals from the final flight.
This was his first run over three miles and it brought improvement, with a truer test at the trip likely to see him in a better light again. He’s gotten better for the move to Olly Murphy and there looks to be more to come.
After taking some time to sort out the mess my travel agency business is currently in, I thought it would be a good time to start making some meaningful contributions to the site again, writes Chris Worrall.
I propose a series of articles looking at which trainers fare best in certain months, which fare best at certain tracks and a whole host of stat-based pieces. If there are any particular angles you'd like me to explore on your behalf, please ask.
I'm regularly looking for new angles as a way in to finding a bet and largely because I need to find selections each day for my Stat Picks service and, more importantly for Geegeez readers, a daily selection for Stat of the Day.
What is Stat of the Day?
Well, in mid-November 2011 (have I really been here nearly nine years?!), Matt said to me "I've had an idea for a daily piece we can do between us", and a pillar of geegeez was conceived. The basic premise around the service was - and still is - to highlight one horse each day that statistics suggest has a decent chance at a decent price that also offered some value.
It was never really intended as a tipping service and, although we now keep basic data re: strike rates, profit/loss & ROI, it still isn't a tipping service as such. Well, I don't think it is anyway. My aim is to fulfil the original brief: one horse per day with a chance at a reasonable price but, more than that, to highlight one or more statistical angles you can use to help in your own betting. The picks are not incidental, nor even are they secondary, but there is much more to Stat of the Day than the name of a horse and a price.
In recent years, I've been the main contributor to the service, as Matt's time has been needed elsewhere on the site, but it remains a team effort. [It's 99% Chris, 1% me! - Ed.]
How do I land on the daily selections?
Well, it's probably not the most time-efficient method, if I'm honest, but I'm a little set in my ways. So here goes.
Stage 1: Longlisting
Like many of you, I have a stack of stored angles created via Geegeez' excellent Query Tool (and I'll be sharing some of these with you in due course). I also have a large number of saved angles on the also-excellent Horseracebase site and each evening I'm able to access a list of horses that are set to run the following day.
In addition to those two lists, I look at the Geegeez report suite for the daily Shortlist and also My Report Angles, where I have my own preferred parameters set up. So, after consulting these four places, I'm presented with a large number of runners and that's stage 1 complete.
Stage 2: Eliminations
Stage 2 involves putting all the races where I've got possibles into track/time order and it's at this point that I first look at the Geegeez racecards page, which I then use to cross off any races I wouldn't want to get involved in for SotD purposes. It's not an exhaustive list and I do sometimes make exceptions, but generally I get rid of maiden races (but often keep maiden handicaps), flat /AW novice non-handicaps, median auction races, bumpers (NH Flat), Irish racing, and races with 14 or more runners.
Stage 3: Further Analysis
I'm now left with a number of races to assess with one or more possibles and it's only at this point that I actually look at the racecards themselves. I then use a mixture of Instant Expert, Pace/Draw, Head to Head, Full Form and that unquantifiable gut feeling to establish I believe have a decent chance of winning and I then eliminate those that don't.
Stage 4: Value Judgement
This can then leave me with anything from one to ten runners on a shortlist, which I then put in the order I feel are most likely to win. Once I've got that pecking order in place I will, for the first time, look at the prices available. I'll have an idea in my head of what kind of price I'd want for each runner and so I start at number one and check if (a) it's available at 5/2 or longer (my own general minimum cut-off for SotD) and (b) if it's priced close to or higher than what I'd wanted it to be.
I'm aware that the last part is arbitrary, but I've developed a "feeling" for what suits and what doesn't over the years. So, if number one fits both criteria, that's the Stat of the Day pick. If it doesn't fit both criteria, then I move to number two and so on.
Do they win and are they worth following?
Anybody who publicly publishes selections at odds of 5/2 or longer will pick many more losers than winners and I'm no exception. But, from the first pick in mid-November 2011 to the end of February 2020, after removing any non-runners from the data we had 2,515 SotD runners grace the track, of which 664 were winners.
That's a strike rate of 26.4% with advised profits of 526.45 points, equating to a 20.9% profit on all stakes. In money terms, almost £1.21 back for every £1 wagered.
As for being worth following, then for most people it's a "yes". We don't blow our trumpet about strike rates and profits etc, nor do we get all melancholy when they don't win. The real value of SotD is still as it was when it started back in 2011: highlighting profitable angles for future reference/usage and hopefully a dollop of jam on today's bread.
The angle used for the next pick (sooner rather than later, hopefully, once this lockdown is confined to history) might not generate a winner for us on that day, but it will produce more winners in the future and if we can steer you towards future winners, then we're not too concerned about highlighting a losing bet on the day.
SotD is most certainly a long-term project and, as with all "tipping" services (I know we say it's not tipping, but it has become widely perceived as one), it has to endure peaks and troughs along the way. We've had, and will have again, long losing runs; and we've had, and will have again, ridiculous purple patches. The overall picture remains a healthy one and I can't wait to get going again!
What kind of angles do I use?
Well, some are very simple horses for courses type approaches, or trainer/track combinations, whilst others can be more complex; and I'll be bringing you some examples over the coming days/weeks until racing resumes. So, if there's anything you'd like to look at, please let me know in the comments below.
Thanks for reading and for following Stat of the Day if that's you.
Chris
https://www.geegeez.co.uk/wp-content/uploads/2015/09/stat_of_the_day_white_letters-e1460311997762.jpg319830Chris Worrallhttps://www.geegeez.co.uk/wp-content/uploads/2022/10/geegeez_banner_new_170x78.pngChris Worrall2020-04-06 11:13:292020-04-09 14:49:00Stat of the Day : An Overview
Did you miss me? I missed myself. I think that was only the second blank week since I started my musings more than eight years ago, writes Tony Stafford. I relayed my withdrawal symptoms to the boss and he gave me the all clear to resume, but no 4 a.m. Monday for me. The other day, the phone rang and I looked at the clock, it was 8.45 a.m., the latest I’d awakened in decades.
There’s been a slight confusion whether these offerings have been musings or meanderings – the latter term hardly describes my physical movement over the past three housebound weeks.
No racing, football, cricket or anything else. Just three-hour daily afternoon sessions with eons-old reruns on Channel 120 – ITV4, the place we see ITV racing when 103 is tied up – of Minder, The Professionals and The Sweeney from around 1980.
Sometimes, when I was the editor of the Racehorse magazine at that stage of my career – doubling up with my Daily Telegraph job to help pay off Mr Lippman – we’d be out for lunch In Battersea and see them filming The Sweeney. – Sweeney Todd, Flying Squad for those of you without the rudiments of Cockney rhyming slang.
In those days I had a fair knowledge of day-to-day form. Racing was not encumbered with anything like the volume of bookmaker-benefiting dross of today, but I had an opinion on pretty much every race, just as well as I had to make a selection in them all each day for the Telegraph. Even holidays brought no respite from the sausage-machine of racing and betting even if most of it was not televised.
Now we see it all, except in Covid 19 Great Britain there’s nothing to see. There’s only Hong Kong twice a week or the odd still-soldiering-on action from one or two tracks in the US. I rarely bother with either.
Then suddenly, on Saturday, the 18th consecutive day without horse racing in the UK, we had the Computer Grand National, 40 runners over what passed quite impressively and realistically for the track. The horses’ gaits and strides over the fences, while a generation up from the early betting shop “jumps” computer tracks, still had an artificial look about it. I suppose it would!
What struck me again, and I’d mentioned it after the autumn Aintree meeting, was the totally-unexpected difference to Becher’s Brook. Where the horses used to have to stretch to clear the gaping breadth of the brook while ideally half-turning in midair to take the immediate left turn towards Valentines, they now appear to go straight on. The fence has been rendered pretty innocuous in fact and its computer-model looked even more straight-forward on Saturday. That’s a big loss for purists, but then 30 fences and almost four and a half miles is test enough for most people.
Anything computer-generated needed human input to provide the data for whatever device crunched the numbers to elicit the result, so the outsiders in the market almost by definition, were most unlikely to prevail. Punters, or even in many cases, non-punters, because in normal times plenty of once-a-year bettors break their annual disinterest with racing and have a flutter on that Saturday in April at Aintree, grabbed at the chance of relieving the present torpor.
Trainer Ian Williams had the initiative to set up a sweepstake on the race, offering handsome prizes for the lucky few to secure horses “finishing” in the first four. As I said, the computer was hardly going to reward those of us unlucky enough to land on a rag.
In the old days, I’d invariably had a Grand National fancy on the day of the weights, always tipping and backing it at that stage, and enjoyed plenty of winners over the 30-year spell. Those were the times of office sweeps when unfailingly I’d get one of the outsiders. Yesterday my name came out alongside the 66-1 shot Peregrine Run. I can safely say I’d never previously heard its name and marvelled that his black and red colours were relatively prominent for much of the “race” before wilting away as 66-1 shots were bound to do.
It seemed after the event that Ian reckoned around £4,500 had been earned for charity from that single event. I think he had multiple – possibly four – full fields, so the offers of expensive meals for two in a top Birmingham restaurant, champagne breakfasts for four at his stables quite close to the Second City and other lesser prizes were recycled and put up for auction by at least one of the winners.
On his What’s App feed, Ian even showed pictures of his stable’s real horses gently exercising with the riders all keeping appropriate Social Distancing. For those of us who did take part, it was great to see somebody bringing enjoyment at such a time of fear and unease.
When I first got to know Raymond Tooth, one of the main reasons we met was the input of Derek Hatter who had known Ray in business for many years. Derek dropped out of our little team around six years ago when already just into his 80’s and it was sad to hear that his elder brother Sir Maurice Hatter had died aged 90 last week. Sir Maurice was a great man in charity work with his wife Lady Hatter for many years and the news of his death made me wonder if Derek is fit and well.
So where are we now? After a couple of weeks, I’m reading almost a book a day; am surprisingly rubbish at sudoku; only slowly taking off the surplus pounds from the last year’s excesses – probably solely because there are no more Set 1 breakfasts at the café – and am still in the early stages of a fitness regime.
Meanwhile horses have to be exercised and fed, although most jumpers will have been “roughed off” with the BHA announcing no jumping until July, concentrating on a return to Flat racing before that. The jumps trainers will have had some respite in that at least the weather has become much more Spring-like with the prospect of new young grass on the horizon in place of the bare and flooded fields of winter enabling turning out.
Everyone is raring to get going again, but as Derek Hatter always used to say when discussing anything to do with money or life. “Everything’s the same all the time, it’s just different numbers!”
The key will be those graphs which will hopefully show a slowdown and then downturn in deaths and new Covid 19 cases. At the moment, the total to have died in the UK is fewer than 5,000, which is less than one in 10,000. As one of the leading healthcare experts suggested last week, the UK will be “doing well” if the death toll is restricted to 20,000. That would be around one in 3,000. If you stay healthy and stay safe at home, as I intend to continue to do, we should hopefully all be around when the world gets back to normal. Different numbers.
https://www.geegeez.co.uk/wp-content/uploads/2020/04/vgn.jpg320830Tony Staffordhttps://www.geegeez.co.uk/wp-content/uploads/2022/10/geegeez_banner_new_170x78.pngTony Stafford2020-04-06 06:45:062020-04-05 16:49:52Monday Musings: Different Numbers
In this bonus module, Part 3b, you'll learn about something I call 'mark up' angles. These are snippets of information which are not necessarily worthy of a bet in their own right, but will help me to form a view on a horse in the context of a race.
Again, if you've not seen the previous episodes, I urge you to start here.
In this bonus recording, we'll look at mark up angles for:
- Sires
- Wind surgery runners
And we'll also look at horse profiling within Query Tool. Adding a few of these to your Tracker for the upcoming flat season will be a VERY good use of an hour or two during this downtime!
Here's the video - I hope you like it.
Matt
p.s. If anybody has any questions, I will be happy to record a QT Q&A session to help you get you out of the blocks as quickly as possible.
https://www.geegeez.co.uk/wp-content/uploads/2020/02/WindsweptGirl-e1603189967643.png320829Matt Bisognohttps://www.geegeez.co.uk/wp-content/uploads/2022/10/geegeez_banner_new_170x78.pngMatt Bisogno2020-04-02 19:34:002020-04-02 19:57:08Horse Racing Betting Angles: Part 3b, Bonus Module
The draw and potential draw biases is where my interest in horse racing began, writes Dave Renham. Back in the late 1990's I remember reading some excellent draw articles by Russell Clarke in a magazine called Odds On and I was hooked. Within days I was doing my own research using my Superform Annuals and pen and paper. This progressed to putting data into computers using excel.
I dread to think how much time I spent collating data. My main memory is working on my computer from 10pm to 2am on a regular basis. However, in those days the hard work was worth it because it was still a very under-researched area and draw biases were quite strong at certain courses. In addition to that, it was at a time before racing computer programs were commercially available.
It is over 20 years since I wrote my first book on draw bias and how things have changed since those ‘good old days’. At this juncture, it needs to be pointed out that many of the draw biases that were around 15 or 20 years ago are either not as strong as they were, or have disappeared completely. For many years draw biases provided punters with money spinning opportunities, me included. Virtually all my decent winning bets from around 1997 to 2006 were influenced by the draw in some way.
However, as with most things, when a good source of highlighting winners is found, within a few years the edge starts to disappear. This is very much a horse racing trait - good ideas gain an initial edge because the majority of people do not use that winner finding approach. As time goes on however, the betting public and the bookmakers catch up, and as a result the prices tend to contract and the value begins to disappear. This has happened with the draw, and to confound the problem course officials started using other means of negating potential draw bias. Running rails are now moved in order to keep horses off the fastest strip of ground, and better watering and drainage systems mean that most straight courses are far more even than they were back then.
The draw has had massive exposure in the past, and with people realising the edge is disappearing, the subject is beginning to assume less importance. However, before we begin to write off the draw completely, I still believe there is an edge for the educated draw punter. I maintain that at certain tracks a poor draw can still all but wipe out the chance of a horse, while a good draw increases one’s chances considerably. The trick perhaps is to find biases that may be more subtle, or at least which most punters are less aware of.
During this period of racing inactivity I plan to look at a few individual courses in depth, focusing primarily on draw bias but looking at pace aspects as well. The first course that will be put under the microscope is Pontefract.
Pontefract is located in West Yorkshire and is a left-handed track that is undulating with a stiff uphill finish in the home straight. Indeed the lowest point on the track is around the six-furlong start while the finishing post is the highest point, meaning both the five- and six-furlong sprints are testing.
The course is around two miles in length and, something I didn’t realise, is that originally it was around four furlongs shorter. Being left-handed one would assume that lower draws may have the advantage over high drawn horses at some distances, but the proof of the pudding, as always, will be in the eating!
For this article I am using key tools on Geegeez: namely the Draw Analyser, Pace Analyser and Query Tool. The period of study is a long one – going back to 2009, but I will examine more recent data in detail too.
My draw research has always focused on handicap races only. My belief is that handicap races give a better and fairer data set as such races are generally competitive affairs. When analysing each handicap race, I divide the draw into thirds - those drawn in the bottom third (low), those drawn in the middle third, and those drawn in the top third.
It should also be noted that I also adjust the draw positions when there are non runners – for example if the horse drawn 3 is a non runner, then the horse drawn 4 becomes drawn 3, draw 5 becomes 4 and so on. On a completely fair course the winning percentages for each "third" of the draw should be around 33% each. The differences in the percentages will help to determine the strength of the bias. The good news is that the Draw Analyser on Geegeez makes exactly the same splits, and is also capable of calculating draw by the advertised stall in your racecard and the actual stall, accounting for non-runners.
In my experience, I consider there to be two types of draw bias. Firstly, clear bias towards one specific section of the draw; this is the strongest possible bias. Secondly, one can get a bias against one specific section of the draw.
Another key factor to take into account is field size: for potential draw bias to exist I maintain there needs to be a reasonable number of runners in the race, and eight or more runners is the figure I have chosen. Draw bias is far more likely to be prevalent in larger fields as horses will either be forced to run wide (hence having further to travel), or be forced to run on a part of the track where the ground may be slightly slower. If the data set is big enough I will look at bigger field data where I feel it is appropriate.
OK time to crunch some numbers.
Pontefract 5 furlongs (8+ runner handicaps)
There have been 89 qualifying races - five-furlong handicaps with eight or more runners - during the period of study. Here are the overall draw splits:
Despite the track being left handed and the 5f distance having a bend to run round, low drawn horses do not dominate. The A/E values below suggest that the low drawn horses are overbet and are essentially poor value:
For the record, if you had bet every horse from the bottom third of the draw at £1 per bet you would have lost £136.34; backing all middle draws would have lost just £9.62 at starting price.
In the following table individual draw positions have been broken down for 5f 8+ runner handicaps at Ponte:
A few individual stalls made a profit but clearly there is no pattern to this so I would not be advocating backing certain draws in the future.
Field size seems to make no difference in the draw figures, but I was keen to look at whether the going made a difference. Back in the late 1990s and early 2000s when the going got testing in sprint races at Pontefract, horses tended to head towards the near rail in the straight giving higher draws an edge. Unfortunately for the minimum distance we only have 15 handicap races that have occurred on soft or heavy going; but, interestingly, lower draws have won 9 of the 15 (66.66%). That's far too small a sample from which to make any concrete conclusions; however, the 6f stats may give us more data to work with and may hopefully will show correlation.
Regarding 5f soft or heavy ground runners, you would make a very small profit backing lower drawn horses each way (£3.03 to £1 level stakes).
Let us look at pace and running style now. Here are the overall figures:
An notable edge for front runners can be observed. Moreover, better than 52% of horses that took the early lead went on to finish in the first three. This implies a strong front running bias.
On good ground or firmer the front running bias gets even stronger – early leaders win 20.48% of these races with an IV of 2.15. On good to soft or softer, conversely, front runners have failed to win any of the 22 races. It will be interesting to see if a similar pattern emerges over 6f.
Lastly for the five-furlong range, a look at draw / pace (running style) combinations for front runners in these 5f races:
Due to the left handed nature of the course/distance one might have expected more leaders to have come from the lowest draws. Interestingly, though, those horses that led from the bottom third of the draw (low) only managed to win three races from 39 attempts (SR 7.69%); A/E 0.51.
Horses that led early from middle draws went on to win over 25% of the time giving a positive A/E of 2.66. One additional stat is worth sharing: horses drawn in the bottom third of the draw (low) that were held up early have a dreadful record, winning just 2 races from 98 with an A/E of just 0.17.
Pontefract 5f Handicaps (8+ runners) Summary
The draw seems to be fair with no bias, while from a pace perspective front runners do have an edge.
Early pace is generally far more material than stall position.
Horses held up from a low draw have a terrible record.
*
Pontefract 6 furlongs (8+ runner handicaps)
There have been 153 qualifying races over six furlongs during the period of study. Here are the overall draw splits:
There seems to be a small advantage for lower draws here. It may not be hugely significant but is worth further investigation. The A/E values correlate to a certain extent as shown below:
A look again at individual draw positions and how they have fared over time:
Stalls 1 to 3 have decent individual A/E values and stall 2 has secured a long term profit. However, backing this draw blind in the future looks a less than robust way to produce a profit. I would be encouraged, however, if a horse I fancied was drawn in the bottom three stalls – this would be an extra tick in the box as it were.
This graph, which shows IV3 (the average Impact Value of a stall and its closest neighbours, e.g. 456), helps to visualise the table above from a 'likelihood of winning' perspective:
Looking at field size, low draws have the strongest edge in smaller fields (races of 8 or 9 runners). There have been a decent number of these races – 62 in total. The draw split for winners as follows:
The A/E value for low drawn horses edges up to 1.06 here. It seems therefore that a lower draw is more preferable in smaller fields. It is nothing to go ‘crazy’ about but a lower draw under these circumstances does look preferable.
What about the impact of the going in Ponte handicaps over six furlongs? It was noted above that, on soft or heavy ground in 5f handicaps, low draws seemed to have an edge albeit from limited data. In handicaps over a furlong further, the soft or heavy draw stats look as follows:
Again this data set is quite small (21 races), but a look at the win and placed data - table below - strongly suggests a lower draw is preferable:
For the record, backing all low-drawn horses EACH WAY on soft or heavy ground would have secured a profit of £19.57 to £1 level stakes.
Next follows a table illustrating the effect of pace and running style:
An edge for front runners again, while hold up horses have a relatively moderate record. When looking at 5f races earlier it was noted that front runners did better on firmer going and had struggled in testing ground. Unfortunately, from a statistical point of view at least, the complete reverse is the case here with front runners having performed far better on testing ground: indeed from the limited sample they have won over three times more than would be expected statistically. So one potential theory goes out of the window!
Again, we'll close out the distance review with a look at draw / pace (running style) combinations specifically for front runners in 6f handicaps:
As with the 5f range, horses which are drawn high are less likely to get to the early lead - in this case approximately half as likely as those drawn middle or low. There is little to choose between low and middle drawn horses in terms of getting to the early lead.
However, it should be noted that higher drawn horses that got to the lead have managed to go on to win almost 20% of the time.
Pontefract 6f Handicaps (8+ runners) Summary
To conclude, the 6f trip seems to offer low drawn horses an advantage which appears to increase in smaller fields.
The bias towards lower draws has been stronger on softer ground where, conversely, higher draws have struggled more.
*
Pontefract 1 mile (8+ runner handicaps)
Most people focus their draw attentions at sprint distances, but a mile for me has always been the key distance at Pontefract in terms of the draw. From my previous research, lower draws traditionally had a decent edge over a mile so let’s look at the current data. There have been 142 qualifying races which gives us a really good chunk of information:
As expected the low draw bias is strong, with the A/E values not surprisingly following a similar pattern:
And here is the performance of each individual draw since 2009:
Draw 2, as it did over 5f and 6f, shows a blind profit. The A/E values for draws 1 to 3 are good as one would expect. This table does show quite neatly the draw bias in operation – several columns show this such as the win% column, the ew % column and the A/E column.
Once more, the IV3 chart brings the point home:
As this mile trip indicates a strong bias it is worthwhile checking a more recent subset of the data to confirm the long-term perspective. Focusing on the last four seasons (2016 to 2019), during which time span there were 54 races, gives the following splits:
These are similar results albeit a slightly lower win percentage for the bottom third of the draw. However, it ratifies the bias which has been around for years remains alive and kicking.
A solid footnote is that in the past four seasons 23 of the 54 mile handicap races with eight or more runners were won by horses drawn 1 or 2 (SR 42.6%). Compare this with just eight wins achieved by the two highest drawn horses.
In addition, for those who like ‘exotic’ bets, you would have made a small profit if you had permed the lowest two drawn horses in every race in £1 reverse exactas: £14 profit from a £108 outlay. Of course an exacta is a pool bet so it is difficult to exploit potential draw biases in this way as such ideas, if overbet, would contract the returns. Having said that I have personally had much success in the past perming certain draws at certain tracks.
Back to the complete data set (going back to 2009) and a look at mile handicaps by number of runners - specifically looking at fields of 8 or 9 runners - there have been 53 races with the following draw splits:
A stronger bias it seems for lower drawn horses in small fields. The A/E values back this up as is shown below:
There also is a strengthening of the bias in bigger fields albeit from a relatively small sample. In races of 14 runners or more, 19 of the 30 races (SR 63.3%) have been won by the bottom (low) third of the draw.
Turning attention to the state of the turf, the win percentages for low drawn runners are extremely uniform and I have found nothing of note there.
However, with regard to pace and running styles, there are some factors to keep in mind. Here are the overall stats:
In racing in general, as the race distance increase so front running biases start to diminish. However, at Pontefract there is a stronger front running bias over a mile than at 6 furlongs. I found nothing of interest when delving into going considerations and field size, so nothing extra to report there.
Finally over this mile trip this is how the draw / pace (running style) combinations look for front runners in 1 mile handicaps:
These stats demonstrate that it is much easier - or at least more common - for a horse to lead from a low draw over a mile at Pontefract. Having said that, high drawn early leaders have gone on to win slightly more often in percentage terms. Horses that race mid division or are held up when drawn in the top third of the draw (high) have won just 7 races from 285 runners.
Geegeez Draw Analyser has a heat map to help visualise this, here displaying IV:
Pontefract 1 Mile Handicaps (8+ runners) Summary
The mile trip at Pontefract shows a significant draw bias to lower drawn horses. It is one of the strongest mile biases in the UK, if not the strongest.
From a pace angle, it is preferable for a horse to lead or track the pace.
The final distance to be examined in this article is a mile and a quarter. The configuration of the track means that there is an extra bend at this distance as compared to the mile trip and hence one would expect low draws to again have a decent edge. There have been 107 qualifying races from which to find angles:
On first view this looks a very strong bias with lower draws dominating and higher draws seemingly at even more of a disadvantage than they were at a mile. The A/E values back up the raw win percentages as a measure of profitability:
Indeed backing every horse drawn in the lowest third over ten furlongs at Pontefract (8+ runner handicaps) would have returned £39.90 to a £1 level stake.
Individual draw data next, and can stall 2 make a blind profit yet again??!!
Yes! Stall 2 has made a blind profit again - meaning it has been profitable at every individual distance up to 1m2f - as have stalls 3 and 4. Again, this table helps one visualise the strength of the low draw bias. Would I consider backing draws 1 to 4 ‘blind’ in the future? No, but it is clear that these draws must be the primary focus when analysing these races. Here is the IV3 chart to bring that home:
Time to check out more recent data to see whether the bias has been as strong over the past four seasons (2016-2019). There have been 33 qualifying races during that time, giving these stats:
Whilst it is not quite as strong, that could simply be down to the smaller - less reliable - sample size. It still indicates that low draws have a substantial advantage over higher ones.
Moving back to the complete data set (2009-2019) the low draw bias seems to strengthen considerably as the field size grows. This makes sense as the extra bend potentially helps lower drawn runners and impedes higher drawn runners who have to race wider. In races of 12 runners or more, 20 of the 31 races (SR 64.52%) have been won by the bottom third of the draw (low). The A/E value stands at a very healthy 1.25.
Indeed moving the goalposts up further - to 13+ runners - low draws have totally dominated, winning a huge 17 of the 22 races (SR 77.27%). The A/E value for low drawn runners is an uber-impressive 1.53.
Looking at going data there is something which stands out albeit from a limited sample. Races on soft or heavy seems to increase the strength of the low draw bias. From 21 races 15 were won by a horse in the lowest drawn third of the field. That equates to over 70% and an A/E of 1.55. Of course with limited data one cannot be too dogmatic, but these figures are still highly promising.
A look at the pace / running styles figures next:
Front runners have a stronger edge than I had expected, winning twice as often as most other run styles: maybe that extra bend near the start helps.
And finally, the draw / pace (running style) combinations for front runners in 1m2f handicaps:
Lower drawn horses as expected lead more often and roughly four in seven of them go on to finish in the first three. High drawn horses tend to struggle when racing mid division or when held up. This was also the case over 1 mile as we saw; over 1m2f such runners have won only five races from 207 runners.
Pontefract 1m2f Handicaps (8+ runners) Summary
The 1 mile 2 furlong distance shows a similarly strong low draw bias to that at a mile, and it seems that bigger fields may accentuate this.
Soft or heavy going may also strengthen the bias but that notion is based on limited data and so a watching brief is recommended.
*
Fingers crossed, in the near future we will see race meetings start again at Pontefract and, when they do, I hope these stats will help point you in the right direction in the ‘fight’ against the bookmakers.
- DR
https://www.geegeez.co.uk/wp-content/uploads/2020/04/Pontefract_Pipalong_BillesdenBrook.jpg319830Dave Renhamhttps://www.geegeez.co.uk/wp-content/uploads/2022/10/geegeez_banner_new_170x78.pngDave Renham2020-04-01 14:03:092021-08-10 13:58:21Pontefract Draw & Pace Bias
This series of articles and videos has been designed to help inquisitive racing fans to understand more about the sport they love. Whether for betting or another, perhaps breeding research, purpose, there is much intelligence to be gained from looking beyond headline numbers; and Query Tool is a feature of Geegeez Gold which facilitates just such digging.
In the first part of this third part - part 3a - it is time to get into some examples. The angles highlighted have been selected in such a way that they provide a small amount of statistical 'nutrition' in and of themselves; but I hope their real value is in leading the viewer to conduct his or her own research along similar - or very different - lines.
I very much hope you enjoy it.
Matt
p.s. I strongly encourage you to take a look at the first two parts before diving into this one.
p.p.s. the subtitles took a very long time to add, but that doesn't mean they're useful. Please do leave a comment and let me know if they enhanced your enjoyment or were irrelevant. I'll not be offended - far from it, if I don't have to spend another nearly six hours of my life doing that again, I'll be delighted!
Full video transcript
So before you start pressing or clicking any buttons in anger the first thing to think about is a scenario.
What we essentially want to do is test hypotheses or theories or ideas that we have.
Using the Query Tool
So what kind of scenarios can you see?
A few examples would be trainers in certain situations like maybe early season trainer form or trainers.
Maybe trainers by jockey, maybe big trainers
Not their number one.
What about the impacts of wind surgery? We can look at that, we can look at first time after a wind op.
Any number of times after wind op. We could look into the sires or jockeys or racecourses from a draw pace perspective. There really are any number of possible scenarios to dig into.
In the remainder of this video what I'd like to do is highlight some
examples of a given scenario. So for instance,
I will evidence one trainer and we'll find a jockey to go with that.
But you of course you go away and look at...
With trainers there are any number of UK and Irish trainers who have had
400-500 runners per year so they have big sample sizes to work with and you won't always find
valuable angles. Sometimes, very often, you'll come up dry but the whole point is if you if they were all profitable then everybody would be at it and the fact that we have to work a little bit harder not a lot as you'll see but a little bit harder represents a barrier to entry for a lot of people as well of course as not having
ccess to a tool like Query Tool
Ok.
One other thing that I want to say before I start I've been asked a couple of times about parameters how should I set things up Matt? What sort of win strike rate should I look for? Where should I be with A/E and IV? What kind of return on investment should I be looking for?
The answer to this question is it's up to.
The key thing to think about win and to a lesser degree place strike rate they basically tell you how long you'll
go between drinks. A lower strike rate will mean you need a bigger bank and more discipline: if you can't handle losing runs you need a high strike rate to keep you
in the game as it were, and so there's no point researching an angle with a 10% hit rate because you could very easily go 35
qualifiers without a winner, and that's not going to work for you.If you normally bet quite short and you need lots of winners to keep you engaged then you're going to be looking you need to be.
The win percentage maybe 25 or 33%, you need to set it high
to suit your tastes.
Likewise if you want something that wins often you can use IV and say one and a half on IV and that's going to give you certainly relative to the peer group it'll give you
those qualifiers who win
one-and-a-half times or more than average. The point I'm trying to make, and it is a really important point,
worth taking time with upfront, is that
the angles that I show you,
and the angles that you research,
they might be exciting in terms of their profit or their ROI...
But if they don't fundamentally suit the way you bet,
you're going to give up on them.
This applies to any system or service you might be interested in trying as well: if the fundamental metrics of that
angle or system or service are not aligned with the way you see the betting world, with how you want to...
you appetite for risk,
the number of bets you want to place, another one is your tolerance for losing runs.
If the metrics don't match up against
those things which are personal to you
the angle is going to fail for you. Not necessarily because it's a bad angle or a bad system or service, but because it doesn't meet your personal requirements.
I hope that makes sense. It's a really, really important point and, actually, if you take nothing else away from this video, please take that away because that will stand you in good stead going forward. You need to find something that suits you. Not everything will.
Ok good right now let's crack on the first thing I want to look at then I'm recording this on the last day of March we are in a lockdown this year 2020 you might be in 3 years time content will remain valid in its conceptual form the data will obviously move on I hope I hope we have some racing in the next few years so for the 31st of March is traditionally,
in any normal year we would have just had
Doncaster and the Lincoln.
And we'd be started in the flat turf season.
I'm going to kind of pretend that the flat turf season has started and I want to look at early season trainer form.
So to do that I'm going to
MONTH and I'm going to choose March, April, May.
That's my early season.
I'm going to go to the RACE
box, just going to look at UK for now but obviously we could do this in Ireland as well.
RACE CODE, Flat Turf and Flat AW.
That kind of gives us a look at those trainers who in the month of March have been in good form on the all-weather which
gives us hope that they will take that early season form into the turf, but it also doesn't preclude those who don't bother with AW and go straight to the grass. So that's that, race code, so I'm going to change it two years as well.
I'll just click GENERATE REPORT and see where we're at.
And we've got 27,000 runners there.
Just a reminder of the filters so far we got lost two years March April May flat races in the UK.
Ok.
Now look at this data by
Trainer. I'm going to now look at RUNNER
I'll click the
TRAINER radio button, now this is the order by button. I'm sure I referenced it in part 2 but just as a reminder: the left-hand radio grey disc, if you select one of those in this case, TRAINER
And then hit GENERATE REPORT which I'll do in a second.
Summary box instead of just having this overview row
will have a breakdown by whatever you chosen to order by: in this case trainer. But it could be jockey, gender, it could be headgear, whatever, so let's hit the Generate
Report button and see what happens. It might take a few seconds to come back.
Because it's quite a big dataset.
And there we are.
All sorts of guys and girls in this list sorted alphabetically by surname we've got these with, like,.
two runs and three runs and they're not really any use to us so I'm going to apply some filters in this.
Anyway, these boxes here. Hopefully my cursor
is making a nice yellow circle where I'm clicking.
I'm going to say.
At least 20 runs, although that feels like not enough probably.
I'm going to set my win percentage at 15 which is roughly 1-in 7 and again you know that might be to low for some people; I'll set my each way to 33%.
And I'm going to do 1.25.for
A/E and IV which will all be familiar now because you checked out the information from parts 1 and 2 in this three-parter.
Ok so I'm going to click update and as you remember this is a list alphabetically ordered and it's alternate row shaded. When I click update it's simply going to
hide those rows of data that don't match my parameters here. It's not going to look as pretty as it's not re-ordering, it's just hiding them so I'll click update.
And you can see that we've now got a much
smaller subset of data
for the last 2 years.
What I'm going to do is I'm going to
extend that out maybe to the
last five years
And obviously this is
150 percent
bigger data set than the previous one. We've got a few more entries in here, now what I like to do as a starting point is I sort
Actual over
Expected, high-to-low, like this.
I can see something else that I haven't done.
Oh I have, yes, Paul Nicholls has had a few runs on the flat.
Hmm, interesting.
I am interested in
Karen McLintock.
I'm not sure Garry Moss is training anymore, his sample size is much smaller as well.
Philip Hide not training any more.
I think we'll just go with those for the minute.
I'd better make these 1, I'm not sure I got enough data in the set.
Obviously what I'm doing here is I'm
mucking about with the parameters
to get a bigger, slightly more to look at in the first instance.
I'm kind of interested in
most of those. I'll just stick with these top...
He's definitely not training any more, I don't think he is.
These are quite small sample sizes.
I'm going to leave it at that just with those three there.
What I'm going to do if I just go back to TRAINER on RUNNER and if I open this box up,
by clicking not on the radio, not this side just clicking anywhere in here.
You will see that
those +'s that I selected
have... those trainers have appeared
within the trainer selection box. So if I now click generate report it's just going to bring back those three rows.
It's really important to remember to clear these because all of a sudden you will be wondering where the data is and it is there but it's hidden because it's not satisfying these parameters at the top.
I've done that now.
So I've got 3 trainers that I'm
potentially interested in early season.
Now I'm looking at Paul Henderson,
it's a smaller sample, just 22 runners.
And there's basically no profit there.
For all that the A/E is strong, it's just not going to give enough action I don't think.
So I'll remove him and you can see that the tick's gone there and Generate Report to get rid, so I've got two trainers of interest and just to remind us of our filters.
We got the last 5 years.
UK flat races March, April and May.
And you could actually just set that up
as as an angle as is.
And when Karen McLintock and Adrian Keatley have runners in the UK on the flat
in the early part of the season you would get notified on your...
within the race cards and on the report, that's actually something else I wanted to touch on so let's quickly do that. In the previous video I told you about
how to check your QT
Angles qualifiers.
And I told you about the report.
Which I now can't find, of course.
I didn't mention and I wanted to touch on here.
Is how they show up in the race card. As you remember there's no racing at the moment, so I can't show you how they show up in the race card but this is what happens.
You will see something like.
You would see a number that isn't 0 in the blue number column.
In this case it's a 1.
When you click on that, it will show you the angle in question.
and the Profit/Loss. Basically the data/metrics from that angle.
Now if you can't remember what the parameters were for the angle, if you just hover over it as I am now.
This will happen:
It will bring up your parameters.
Just over it and it will show you, in this case I did the last five years up to 24th July 2018.
5 Furlong flat handicaps.
With these five sires. So I quite like sprint sires.
Obviously the title 'Turf Sprint Sires' is very helpful. I could have put 'Turf Sprint Handicap Sires' or whatever, but this is a little angle that I have saved.
I wouldn't necessarily be backing this horse; it would just be another piece of data that I would throw into the mix when I was looking at this race.
So that's something that I wanted to bring out: the QT Angles
displays on the race card with the
blue numbers. Clicking on them shows the angle in question, hovering over the angle shows the parameters that you set up for that angle.
OK, good.
Right, let's go back to it.
So what I'm going to do I'm actually just going to save that as it is. Now, some people...
Good discipline really is to say right that's my...
That is my five year data...
But why don't we have a look at that, before we save it, let me have a look at it by year.
And make sure that, for instance,
all of the winners didn't come in one season.
You just quickly...
I've selected year here.
Clicked Generate Report and I'm going to sort it by year.
And we can see that...
2015.
Very few qualifiers.
In the full years 2016 through 2019 we can see that there was an approximately, well, there was a 20 plus percent win strike rate.
The each way strike rate was promising as well.
The win P/L has been a bit variable and last year was lower.
Quite a bit lower.
This year.
Two of them have placed so it's in the same bracket.
On a meaningless sample size of four.
It's too early this season obviously we lost the racing now.
I wouldn't be worrying about this year.
So I'm interested in this but I can see a
general degradation of the profit and the A/E figure reflects that as well.
I would be happy to save this Angle and as I say use it advisedly rather than backing these horses blind: it would just be an aide memoire to me that McLintock and Keatley
are trainers to keep on side in the early part of the season.
So then I'd add that to
my QT Angles.
"Early Season Trainers", Add Angle,
And then that's done.
And, of course, like everything else they're all zeros, but that is one angle and you could have an early National Hunt season trainers one, a summer jumps trainers one.
You could have a
sa Summer jumps by track angle. So there are lots of different... this is one example, but there are lots of different other ways that you could cut this data.
So that's the first one. Right let's look at trainers and jockeys now so I'm going to hit my reset.
I'm actually going to refresh the page entirely.
Now this time I'm
going to look at
two years of data
I'm going to go to.
Ireland, just for fun, just to change things up a bit.
I'm going to sort by trainer.
Just do that because I want to see who's got the most
runners.
There probably is some merit in looking at trainers who maybe only have 30 or 50 runners a year.
But really I think the value is looking at the big
Big datasets.
And looking at things that
are maybe less obvious
to the man or woman
in the street.
I'm just going to change this to FLAT (TURF/AW) again
And now we've got a small subset, well, we've got a large number of trainers but a small subset of
essentially volume trainers.
The trainers I'm going to be interested in
I want 100+ wins
And that's going to quickly sort things out.
And then I'm going to sort
High to low.
And let's have a look at Aiden O'Brien. Let's select Aiden.
Generate Report, and that's going to bring just him up. I've got to remember to clear
my filters data here.
Now, I'm gping to say, show me Aiden O'Brien's runners in the last 2 years on the flat.
Sorry Aidan O'Brien Irish runners in the last 2 years on the flat
by jockey.
Click the JOCKEY radio button, click generate reports and then in my summary box.
I got all the different jockeys that Aiden has used in the last two years. Now again we've got these ones and bits and pieces, they're not really meaningful so let's sort by
wins and we'll say, "right well we're just get rid of
anybody with
less than
20 runs", let's say.
Small subset here, again sort by A/E.
And we've got.
Messrs Hussey, Moore Donnacha O'Brien,
Emmet McNamara, Seamie Heffernan,
Paidraig Beggy,
and Wayne Lordan.
Wayne Lordan
is an immediate chuck out and if you're a layer that might be interesting: an A/E of 0.53.
on 150ish.
runners is terrible.
In fairness to him, he's almost always on a second, third or fourth string but nevertheless...
And again you'd need to check
Betfair SP because he might be riding some massive priced horses, but on the face of it these are eminently avoidable.
19 out of 20 get beaten.
5 out of 6 are not even in the frame.
These are not horses to go to war with generally.
At the other end Ryan Moore is quite interesting: 34% strike rate and a small profit, in fact a reasonable profit
at SP. So we'll have a look at Ryan.
Let's take Ryan Moore and Hussey and O'Brien is now training so he's stopped; we'll have McNamara and Seamie Heffernan as well.
The reason I've done that is I've got them here now so what I can do is I can look at them individually and I still got these names here to come back to. I'm going to have a look at
Ryan Moore first.
I want to look at
a bigger data period.
So I'm going to go back 5 years.
And I'm going to sort by year.
And order this by group.
You can see here...
that essentially
what happened
in the last 2 years.
Is not replicated in any of the previous three.
This is kind of precarious territory now because we're not seeing
a replication of the Actual
over Expected, we're not seeing a replication of the profit and loss.
We are seeing that in the last couple of years Ryan's IV has risen.
Now, our job as researchers
is, if you remember the point from part 1, of logic logic logic...
If we can come up with a reason
for this, if we can explain why
in 2017
It was not good, and in 2018 it was good,.
then we've got a bit of a chance.
And there is one credible reason, and it is this.
If I go back to RUNNER
and JOCKEY. And I'm just going to look for
this guy, Joseph O'Brien.
So if I do that and then sort by
JOCKEY
Right now what I want to do is I'm ging to go to my dates and sort that by year.
And what we can see is that
Joseph stopped riding in 2015.
So that would partially explain
these data here. So 2015
Joseph had
plenty of the good Aiden horses.
It doesn't explain 2016 and 2017.
Notwithstanding that the A/E figures for those years are kind of more acceptable than
this one here.
When Ryan was competing in Ireland with
Joseph for the Aiden
rides (apologies for
first name terms).
So where do I get to with this? And again these are the kind of situations that you'll find yourself in when you're doing this.
You've got some kind of make value judgements.
Actually I should have cleared that I don't think it's going to make and difference.
I should have cleared that before.
So we've got a situation here where recent history is promising.
Longer-term history less so.
We've got kind of a partial explanation.
We've got a full explanation for the year 2015.
You can see that as Joseph stopped riding - in 2015 Ryan Moore only rode 27 of Aiden's horses in Ireland.
And in subsequent years he's ridden more, as you can see; and that is probably a factor in these numbers I think on balance it's definitely something worth
keeping in mind because it's the kind of thing...
It's one of these 'Hidden in Plain Sight' angles, it's the sort of thing that everybody thinks must be overexposed.
And it's potentially not.
Now what you might do this in the last 2 years there's kind of 200 runners there you might look at whether it's 2 year olds or Group races only you might look at
which particular
race types
O'Brien and Ryan Moore have combined with for the most success.
And that might be your angle.
This is a trainer / jockey combination and, you know, who would have thunk that
O'Brien, the best trainer in the world or certainly in Britain and Ireland, and Ryan Moore, the best jockey in Britain and Ireland, I think both of them have only got one peer and they're a partnership as well.
Gosden nd Dettori
Who would have thought that those highest of high-profile trainers and jockeys would be
borderline profitable to follow blind.
It really is quite remarkable and it's and it's worth knowing.
Saving it to your angles if that's something that you want.
Let's.
Let's do a slightly less obvious one.
This time I'm going to look at
UK trainers on the flat.
The last 2 years here, you see that there.
And from my RACE conditions I'm going to say UK.
Race code.FLAT (TURF/AW)
And then I'm going to look by trainer.
This is quite big dataset, so it will take a minute for the data to filter in. The query is complete and then it takes a second for your browser to order the data my browser is being told what to do.
And it's got to create this very big table.
And that takes a minute or a few seconds to do.
Right again we've got very small numbers in here so I'm going to sort by number of winners.
So I can see where a sensible cut-off point is.
And 150 wins
gives us plenty
to go at.
Sort by win strike right, now we can see that we've got David Evans who has
volume but low strike rate. I don't really want these
super low strike rate trainers so I'm going to put 10% in.
which actually doesn't get rid of many.
I just leave it like that I think.
So we've got quite a bit of data to go at.
Some trainers,
like Mark Johnson uses Joe Fanning and Franny Norton
extensively and there actually aren't that many left around that. Other trainers like John Gosden will.
use Frankie and Rab Havlin for the vast majority of his. Let's have a look at Johnny G actually.
And Karl Burke
And maybe Roger Varian
So what we've got here are
three trainers who all perform better than average, one of them is a standout and that is Gosden.
We're going to look at Gosden first and again if you remember we can just deselect the other trainers.
That's Johnny G's - again forgive familiarity - that's his overall 2-year
record on the flat. I want to look by jockey.
Select the JOCKEY radio button and generate report and here are the data.
Robert Havlin has had the most rides and winners in the last two years Frankie is quite selective.
Let's sort by A/E.
And again we want to get rid of the small sample sizes.
Let's say at least 15 wins,
Now we've got a much smaller
more meaningful dataset. The first thing to look at is Frankie (Dettori).
See he wins 30% of the time
Slightly.
So let's have a look at that actually overl the last 5 years, I think it might be a profit over the last five.
Break-even, but at exchange prices that will be a profit. We'll go back to two years.
So we got Oisin Murphy, Jim Crowley, Frankie Dettori, Rab Havlin, Nicky Mackay and Kieran O'Neill.
The strike rate for Nicky and Kieran is 20% or lower which in the context of the group
is not really at the level I would like to be, so we'll look at just these four guys.
So we've got four here now.
What we can do is
Rob Havlin.
It's going to be hard, I mean there might be some situations where he's
profitable to follow.
Potentially when he's on a second string so when
he's riding
a horse at
a bigger price to Frankie.
That might be something worth looking at, you can do that with odds by selecting him but I'm going to
deselect him for now.
Generate report and I've got three in here.
I want to look at these guys over the longer term, we could just quickly look at Frankie but I want to look at.
Oisin and Jim as well.
And we can see that
Oisin Murphy
When he rides for John Gosden
I mean 40%.is ridiculous...
It is a small sample size.
And these 30% numbers
certainly Frankie's, on
a bigger sample size are remarkable.
If you're betting in a race where Gosden
has got one of these jockeys up and you're not betting it
You've only got 70% of the winners to go at. Now that might be absolutely fine.
It's kind of a meaningless or misleading start in and of itself but you need to know that these guys are winning a lot of the time. Whether they're profitable or not is another question: in the case of Oisin Murphy who is
the retained jockey for Qatar Racing and it may very well be the case that
a lot of those 50 horses that he's ridden for Gosden in the last five years were for his retained owner.
That's by the by, what we need to know is that this is a guy worth following. So you might save this angle as...
Gosden and Oisin.
And add it to your setup and then when they have a qualifier you get your Gosden and Oisin...
You get your blue number here and it will tell you the numbers and you'll be able to factor that into your overall consideration of that race. It might be you might want to bet those blind or you might want to bet them more selectively as I do. But either way you have that data right in the card there and also on the QT Angles Report.
So those are jockeys and trainers. Maybe we'll just look at one more. Let's go back to
RUNNER and we'll look at the trainers.Let's have a look at Karl Burke
So I've selected TRAINER Karl Burke and I've still got this by JOCKEY.
I want to look at Burke's
rider selections in the last 2 years.
.
Again I'm going to sort it. I want to get rid of the small numbers so let's
cut that off at 50, that's fine.
Sort by A/E.
Ben Curtis is the guy that kind of immediately
jumps off the page.
Let's have a look at Ben.
Now what I want to do is I want to look I want to look by year.
How's things.
Let's go 5 years and extend it out a bit.
That year actually if we look at
the win strike rate in recent years,
2017 and onwards, you can see that the strike rate is around
16%-plus.
But last year was down.
This is one, again it's another value judgement, you've got to kind of say,
"Right, obviously if I got a year like
2017 or 2018 I'd be thrilled to be following these but if I got a year like 2019 where the strike rate was down
and I might be in the hole a fair bit at some.point,
would I be able to stomach that?"
The answer for most people is NO
Only you know the answer for you.
I'd be absolutely fine with this because, again, I'm not backing them religiously anyway. I'm missing winners but I'm missing plenty of losers as well by being selective.
What I want to do with Karl and Ben.
is I want to
look by MONTH...
I want to see, because most trainers have seasonal ups and downs, and looking at trainers by month is a valid thing to do, and often it is
quite instructive.
So I've selected order by MONTH and Generate Report. .
Now we've got some interesting
.
Remember our filters, specifically Karl Burke when Ben Curtis is riding
On the flat in Britain in the last 5 years.
See that there are some ups and downs here and the easiest way to
visualise this is with the CHART.
This is something else I wanted to show you: when you've got a...
When you've got a number of
variables in your parameter, so I've got 'by month' here and I've obviously got 12 months - 12 variables in my parameter.
Or 12 parameters in my variable, I'm not even sure which of those is right! Anyway,
what our charting software does is it takes half the dataset, or sometimes a smaller percentage. But if you click .
in the top chart,
it will show you everything. Now sometimes, if you've got like a 1000 trainers in here that's going to be not going to be able to make sense of this so what you can also do is if you click and drag
you can select
a section.
of the chart to look at in more detail. And when you've got 1000 in here that selection I've made there which is, what?, about a quarter, that's still going to be 250-odd so I might actually be only wanting to
look at a smaller subset like that.
A single click and you'll get the full dataset. Right, so here we've got Burke and Curtis.
It's sorted by Win PL I'm going to sort it by A/E, which is a good friend of mine and again clicking in the chart [to view all data].
What we need to note here.
1.0 is the line of interest in A/E (and to a lesser degree IV).
And what we can see here.
In the early part of the year.
Certainly January-February March.
And the late part of the year - October November December - this is a period that obviously aligns with the all-weather.
Karl Burke and Ben Curtis have had a good time of it.
In the summer months,
less so and particularly less so between
July, August
and September
I mean that's perfectly legitimate in my opinion.
To accept that seasonality I mean if you look at strike rate.
The average for the year, you can see this at the bottom, it's 16% overall.
And in July it's 10% or 9% in August it's 5%.
And in September it's
12%. It's much lower
than the overall averages in
April May are much lower as well so I wouldn't be including June and excluding April and May.
I'd be either including April and May as well as June, or excluding April through June, if you see what I mean. You've got to put logic behind the theory: now in this case the logic is probably these guys are
mustard on the all-weather and we can very easily check that. If we just
select the ON button here it's going to put all the months on I'm going to take out
May to September.
Is a little bit convenient maybe.
I'm going to do that, and then life looks more rosy obviously but what I want to do now.
Is I want to look at
by RACE CODE
There actually isn't a huge amount of difference.
So the theory about
most of their winners being on the all-weather is debunked.
They look absolutely fine on the flat turf as well so that's interesting that's good. One other thing that I might look at is by handicap or non-handicap.
And again.
Much better in handicap so might though it is profitable in
win profit and loss
terms in non-handicaps but if you look at the A/E that would give you cause for a slight reservation. Certainly
all of the metrics are better in handicaps.
I might change that to handicap and I might revisit my dates and see if that makes
any difference in the summer months.
And actually what it does
is it kind of reinforces
the previous date range
that we selected, which
was October through to April.
So if we delselect the summer months
We've now got...
We've essentially combined the two scenarios we've looked at so far which are kind of a sub-season.
It's sub-season trainer form with trainer by jockey.
Generate the report and we've got a nice little angle here which has been extremely profitable. It's worth looking at by year.
And we can see again that there was a
losing year in 2016.
So, again, are you comfortable with that? The answer might be no.
Generally speaking this is an approach that in the last few years has been a really
good one to have onside, so I'd always be mindful of Burke and Curtis
teaming up in handicaps in in the trainer's good times, which are October through to April.
That's an angle that I think it's worth saving.
So that's saved to my Angles now..
I want to show you one more. I am conscious of the length of this video and I might break it up into two recordings.
I will do that so I'll do this last one on trainers.
Actually I have got one more on trainers, so I'll do that in a part
3b if you like, and some people will obviously have got the general idea by now and choose not to look at
the angles highlighted in Part 3b, others will want to look at those as well.
I mean I would encourage you to look because I think,
not so much for the specific angle, but there are some more scenarios I'm going to highlight which might give you ideas to go and research on your own.
And I think there's plenty of value in that.
Let's go we're going to do another trainer jockey combo.
I do loves me a trainer jockey combo as long term
subscribers will know.
This time we're going to look at Red Raif, as I
somewhat unflatteringly call him.
Mr Beckett, who is an excellent trainer.
And a passionate man.
Somewhat political and not fully aligned with my own view of
the world. But that doesn't make him right or wrong, it just makes us different.
Anyway it is his ability to condition horses that we're interested in here so let's retain focus on that.
Beckett as you can see has a 16% strike rate in the
last two years. If we extend that out to five years, we can see he retains a very consistent strike rate.
And if we look by year,
we can see that he's...
...ignore this part year which is unrepresentative, as you can see by the number of runs, but in the main he
is consistently around 14% to
20%, average 16.5%, very solid overall figures from which to work. So what I want to do is I want to look at...
As you can see down the bottom here we've got two and a half thousand runs
So we've got a bit of data to work with..
So let's see if there are some sensible subsets within that.
We might look at
RACE CODE for flat turf and flat all-weather.
We can see that his strike rate again is consistent.
Nothing really
of interest there.
Distance.
Is he better with sprinters or middle distance horses? He doesn't have a huge amount of runners
at sprint trips.
The ones he does are largely
consistent in strike rate terms, so
nothing really going on there.
Handicap or non-handicap?
Hmm, now that's interesting.
The strike rate is not
massively different, but it is notably different, kind of 10%.
16 + 10% of 1.6 - 17.6 and it is 17.43, let's call it 9% better in handicaps.
And we've got a bit of a chance looking at the A/E figures here and Win PL on a big sample size so I'm going to look at
'Red Raif' in handicaps.
And then we've got this summary number. Now let's look by
RACE CODE
That's interesting.
Distance.
Longer-distance races look
potentially more interesting.
But what I really want to look at is by jockey.
So let's open up the JOCKEY radio button.
Generate report
And get rid of some of these meaningless .
samples, so let's say we want.
we'll start with 20+ and work up from there.
Sort by Actual / Expected
And we've actually got some really interesting players here.
Now Fran Berry has retired and he and Pat Dobbs used to ride a lot for Ralph Beckett, as did
Richard Kingscote as you can see. They had the least good data in terms
of A/E and indeed
in terms of Impact Value which is a reference to strike rate as well so they are easily excluded.
Higher up the list we've got
the likes of Sylvestre De Sousa, Josephine Gordon
I think if we put a
win strike rate of at least 15%
Get rid of some of these so we can focus more clearly and an each-way strikerate of 33%.
Now we're getting to the juice of it. And a problem with Sylvestre is that he's a fantastic jockey - that's not a problem - the problem is that everybody knows he's a fantastic jockey.
Even in this loaded situation, Beckett in handicaps, where
he places his horses very well clearly.
The strike rate is high but we're never going to be able to get rich with this guy.
I think I'm going to look at the other four
You could do more with this but really, it might be worth looking at gender - Beckett is extremely good with training fillies and mares. He's won the Oaks a number of times.
There's not really much difference.
Male horses tend to win more often the female horses.
That's just a function of
genetics I suppose; age is worth having a look.
I just want to sort this by group, so I can get a feel for the linearity of it, if you like.
Rather than cherry-picking
based on A/E
or profit.
Most of his runners are in the 2 to 4 year old age group, it might be worth focusing only on the the younger horses: 2 and 3 year olds.
I think that's probably a legitimate thing to do.
In this example I'm going to leave them all in but you might choose to focus only on those that small group you can see that they're the sort of 5, 6 and 7 year olds have very few runners. They've had 34 runs between them whereas 2-year olds alone in handicaps have had 45 runners in the period so I'm just going to leave it as is and
I think we've got a nice little trainer jockey angle here so Ralph Beckett in flat handicaps.
When he uses Oisin Murphy, Rob Hornby, Louis Steward or Harry Bentley. Now this is a five year view and again it's definitely worth looking at the year by year breakdown.
We can see that there's a
gorgeous consistency here that is an angle researcher's dream such is its
annual profit and its strike rate of
20+% (again, ignore this year because.that's
a small number of runs in the year so far). I mean that's really quite interesting.
We might look by month as well just to see if he has any seasonality to his form.
The easiest way to do this in a chart.
The 1.0 line is here and we see
again in June and July
High summer when trainers are running horses left, right and centre,
firing a lot of bullets,
it's quite difficult to retain
the higher strike rate.
And that has an impact on profitability and therefore A/E.
You might choose to leave
June and July out; I'm not seeing enough there to justify it for me so I'm going
to leave them all in.
Notwithstanding that June and July are
slightly less appealing.
I think it's a really solid angle and I'm going to save it to my QT Angles.
Added.
Alright and that's another angle.
And that is enough for this video I think. I hope
you've seen some interesting angles there. More importantly, I hope you see
some of the considerations that we need to work within when we're considering what might be an approach that suits us and when we're considering
the legitimacy of
data in terms of
it's long-term or future profitability potential.
And I hope this may have inspired you or encouraged you to maybe have a crack at researching some angles yourself. If it has and you've watched this video from the blog...
Please do leave a comment with anything that you'd be happy to share. You might want to keep some of them for yourself, and that's fine, but if you're happy to share that would be fantastic as well. Even if it's
a generic approach.
So, again, like a scenario that people could go away and look at their own
"sub-scenarios".
OK, enough already, this is Matt Bisogno saying thank you very much for watching this part 3a
of the Query Tool series. I hope you got some value from it, I'll be back the part 3b very soon.
But, for this one, byee for now.
https://www.geegeez.co.uk/wp-content/uploads/2018/06/John-Gosden-and-Dettori.jpg320692Matt Bisognohttps://www.geegeez.co.uk/wp-content/uploads/2022/10/geegeez_banner_new_170x78.pngMatt Bisogno2020-03-31 19:08:012020-04-01 07:24:30Horse Racing Betting Angles: Part 3a, Query Tool Examples
In Part 1 of this three-part series looking at horse racing betting angles, I talked about research principles: about knowing what works for you, about the importance of logic and a lot more besides. It's a foundation piece for the next two parts and, if you've not read it yet, I'd strongly encourage you to do that first. Here's the link: Horse Racing Betting Angles Part 1
Parts two and three are video-based for now, though I will endeavour to get transcripts at some point. The middle piece, then, is below, and it provides an introduction to Query Tool, Geegeez Gold's main research module. It can be used to drill down on courses, horses, trainers, jockeys, sires, damsires, and plenty of other things besides.
In this video, you'll discover what Query Tool (QT) is, where it lives, and how it works. You'll see how to visualise your analysis, display qualifiers and, best of all, save your research so that it is recalled when relevant, i.e. when there are qualifiers in the day's racing. Click the play button to watch Part 2.
In Part 3, which you can look at here, we'll look at some examples of angle research, produced with Query Tool. Each example is one element of a group of entities which can be researched. As such, there is ample opportunity for curious readers/listeners to try things out for themselves. Look out for that in the next couple of days.
Matt
https://www.geegeez.co.uk/wp-content/uploads/2017/04/QUERYTOOLIMAGE.png320830Matt Bisognohttps://www.geegeez.co.uk/wp-content/uploads/2022/10/geegeez_banner_new_170x78.pngMatt Bisogno2020-03-28 11:12:122020-03-31 19:11:30Horse Racing Betting Angles: Part 2, Query Tool Intro
To win at betting on horses, or indeed anything, one needs either to be lucky or to be smart. Ideally, one needs to be both. The best tactic of all is to use smarts to make your own luck, and that is how we'll proceed in this three part series. In this first episode we'll consider the cardinal principles, without which anything that follows will be precarious as a basis for betting decisions.
What is a betting angle?
Let's start at the start, and define what exactly is meant by a betting angle. For me it's a deliberately vague term because I don't want to be reduced to mechanistic wagers spat out by my computer's 'brain', even if whatever comes out is a direct result of what I fed in. I'd rather be advised or reminded of a nugget of information when I'm previewing a particular race.
Put another way, if my research tells me Trainer X has a great record with Jockey Y that will generally not be enough in itself for me to place a bet. But it will encourage me to look more closely at the overall profile of the runner around which Trainer X and Jockey Y are combining.
In other words, I want as many extra pieces of information - snippets which will generally be unknown to the vast majority of punters - as possible when I'm weighing up a race. What I don't want to do is simply back a list of horses generated from my angles.
That is system betting, and it works for a lot of people. If that's you, you will find plenty of utility in this series, but my main focus is on micro-angles which will add a point or two to the case for a given runner without necessarily commending it as a bet.
Betting angles then are snippets of information which can help decipher a race and potentially identify a dollop of otherwise unseen value.
No system or angle is God
Horse races are loose forms of organised chaos. An average of ten large animals, steered by small animals, with each other and/or obstacles in their way: there is plenty of scope for things to go wrong. Unsurprisingly, things frequently do go wrong. Thus the best horse often does not win. Rather, the best suited horse to conditions, or the best placed horse from the break, or the horse that makes the fewest mistakes, usually wins.
These kind of 'chaos variables' are generally not factored in to the price of horses at the top of the market, meaning such horses can not normally be considered value bets. Their chances are well advertised by the good judges in the racing media and the weight of money from lazy punters ensures their followers will eventually suffer death by a thousand poor value betting slip paper cuts. Or something like that.
My point is that we need to build in enough latitude to account for what used to be known in my software development project management days as OSINTOT's ("Oh Sh!t I Never Thought Of That"). Stuff happens, regularly in horse races, and our wagering approach must be sufficiently resilient to handle it.
No system is perfect, no angle immune to the bettors' scourge, variance: again, as I like to say, "after a good run expect a bad run; after a bad run expect a good run". Such is the nature of the beast.
For ultra-contrarians, the best time to get involved with a proven tipster or a solid-looking betting system is in the howling teeth of a downturn; after a bad run expect a good run. But only if you firmly believe in the underlying merit of the approach behind it.
Designer babies
We all want to be beautiful/handsome. And we all want to back big-priced winners on a regular basis. But, sadly, we have to play the hand we're dealt. You might have smouldering Dean Martin looks, but I get reminded more often than I'd like about my better than passing resemblance to Mister Bean. Such is life.
And so it is with betting systems. We hanker after the golden goose, the method that gets all the girls. But that's not what we need. What we need is a steady little portfolio of pointers that keep us honest, content and on the right side of both the bottom line and sanity. That is achievable, sustainable, and far more nourishing than a golden goose. How B-O-R-I-N-G would life be then?
This game is about little fish tasting sweet. It is about the thrill of the chase, about engagement and fun: solving the puzzle lower down the lists where others have fallen into its top of the market traps.
There is no such thing as a golden goose system, thank the deities. But there are myriad in's that offer slivers of value, shards of profitable light, to those who care to seek them out.
This series is for you.
A bit about you
On that point, then, let's talk about you.
One of the best pieces of business advice I ever received was to create customer avatars. A customer avatar is a very specific definition of the core client of a business.
Understanding this has helped geegeez.co.uk to stop focusing on 'all horse racing bettors' and home in on 'horse racing bettors who know they want more information than is available for free elsewhere, and don't mind getting their hands dirty in the quest to find their own value picks'.
That's less catchy, and is a very (VERY!) small subset of 'all horse racing bettors', but I can talk to almost every single one of these guys - you guys - as an equal, and expect that what I say will largely resonate with your own general outlook on the racing and betting game.
Back to you and, specifically, your betting approach. If you've read this far, you almost certainly are interested in finding your own betting angles - the good Lord Sugar knows this introduction has been long enough to disqualify those who are not!
But a betting angle that works for you will not necessarily be the same as one that works for me, or that works for the next reader. Some examples will help.
Betting Angle A has a 3% ROI on more than 10,000 selections. That's 300 points profit. Nice right? Well, maybe.
What if Angle A identifies 40 bets per day? What if the average odds of winners are 25/1?
The downswings with an approach like that could run to many hundreds of points. To operate it profitably would require a very large bank, very small unit stakes (in percentage terms), and titanium sphericals. The profit is attractive to all; the modus operandi suitable for very few.
Let's try another.
Betting Angle B has a 9% ROI. It finds roughly 40 bets a year and has been profitable in four of the last five years. In the other year, it lost 28 points. Could you handle that loss and still retain belief in the angle? You probably could if you were being selective when playing it, and if the 40 bets were in a particular context - for example, early season trainer form.
Whether you could or you couldn't, the key here is that while we may all be similar in terms of our general aspirations from the game, we are all different in how we can scratch that itch.
We have different bankrolls, different appetites to risk, different styles of betting, different amounts of time to invest in finding our bets, and so on.
That diversity is to be celebrated: it ultimately means we'll land on different horses and back winners on different days. It won't stop any of us from being profitable or from enjoying our betting as long as we recognise our own terms of reference before getting stuck in.
It is very well worth taking a few minutes to think about your approach, and how optimal that approach is for you. If you use our Bet Tracker tool, you'll have a better insight than most into the way you bet, what works and what needs more thought.
What to look for in a good system/angle
The first thing to say here is to refer back to the previous section: make sure any angle you identify looks sustainable in terms of the way you play. If you need a winner every third qualifier there is little point in deploying an angle with a 10% strike rate; you'll give up on it after a few losers which, almost inevitably, means before you've made any profit.
If you only want to place one of two bets a day, there is little point in identifying a great angle with an average of six bets a day. You'll immediately feel uncomfortable with the different staking and wagering regimen, and that is not a position of strength from which to enjoy the sport.
Any research you undertake needs to be mindful of how you bet: how often, how risky, and so on.
A good system, then, will speak to you personally in terms of its numbers. It will fit your appetite for risk, volume and available time. If it doesn't, it's only a matter of time before you pull the plug, profitable edge or not.
Aside from the personal elements, there are generic precursors to good angles, too.
LOGIC LOGIC LOGIC
The first, and most crucial, component of angle research is logic. An angle should be explainable in a shortish sentence and, if you were explaining it to a fellow punter, she should not spit out her beer in disgust at the case you make.
It is never enough to reason, "well it's profitable". If you can't explain why it is profitable the approach is very likely built on foundations of sand.
It might be fine to have an angle based around big trainers' performance in Saturday handicaps. But it would never make sense to create an angle around performance on Mondays, Tuesdays and Thursdays, for instance. There's simply no underlying logic.
Likewise, trainer angles where there are gaps in the months which qualify make no sense; conversely, however, plenty of trainers have certain parts of the year/season when they're in bloom. As long as there is a consecutive nature to the period, that may well be predicated on the schedule of the yard's year.
Just think 'why' for every variable within your angles. If you can't explain it, you should probably bin it.
Less is (usually) more
The always compelling Tony Keenan wrote about focus for optimal betting decisions in this excellent article. In it, he refers to neuroscientist Daniel Levitin's contention that we should unburden the brain by placing information in the physical world. Keenan talks about 'to do' lists as an example but it is equally true of betting angles: we should move these from our cluttered crania to, well, to a query tool or other aide memoire.
He goes on to reference Levitin's work on something called optimal complexity theory. Here's Tony:
...the idea that too little information is no good but so is too much. This applies with any decision we make, like buying a house or car say. Having too many parameters to consider leads to confusion in decision-making, with humans apparently unable to process more than ten variables for any choice, the optimal number being closer to five.
Betting angles should be simple in the main, predicated on sound logic, and often 'hiding in plain sight'. The more convoluted they are, the more likely the creator has added an extra variable or two to filter out some inconvenient truth. This is a subjective area and one where common sense is our greatest ally. Less is usually more.
Be wary of small sample sizes
The nature of looking at horse racing statistically, which is essentially what angle research boils down to, is that we are invited to make inferences on insignificant sample sizes. The conundrum is thus: too large a sample and the angle is well known and profit gone, too small a sample and the angle is unreliable and may be a fluke.
So what to do? Two things...
1 Seek a happy medium
Somewhere in between those two unsatisfactory sample size groups is a reasonable amount of data and the chance of profit continuing in the short- to medium-term. Where possible, look for as big a sample as you can. An angle with eight winners from ten runners looks fantastic, but how sustainable is that? It's impossible to know on such limited evidence.
One thing we can do in such situations is to widen out the search. For example, if Sire Z's progeny have had eight all-weather sprint winners from ten runners, how does that compare with his turf sprint winners? Or with his all-weather runners overall? We're looking for greater assurance in larger numbers. Chances are we'll still be dealing with relatively small samples, but we'll have a better feel for the sustainability of the micro-micro-sample of ten runs.
2 Proceed with caution
Wise men say only fools rush in
But I can't help falling in love with you
So sung the immortal Elvis Presley, and he wasn't wrong. Once you've satisfied yourself that there at least might be merit in an angle, go forward carefully. Do not rush in. Only fools rush in.
Such angles are prime contenders to be considered in the context of the race overall rather than bet blind. For instance, a trainer with an excellent record with handicap debutants from a tiny sample: is there anything else about this runner to corroborate its chance? Has it been off for more than a month? Is it stepping up in trip, or down in class? Is there a notable jockey change? Has there been money for the horse?
It doesn't take long in most cases to see whether the qualifier should be a 'proper' bet, an 'action' bet, or a watch and squirm job. (For me, there is no such thing as the last named. I'm either betting to win a few quid, or I'm betting to win a cup of tea and a sticky bun, or I'm not betting and I won't cry if the horse wins).
Profit is not the best measure
Most angle researchers have an unhealthy obsession with the Profit/Loss column. Of course we are trying to secure a positive return, but there are any number of traps for the greedy punter whose alpha and omega is pee and ell.
Harking back to what suits a particular bettor, and mindful of the small sample sizes that often manifest, it may be prudent to focus on each way percentage, percentage of rivals beaten (PRB) or percentage of rivals beaten squared (PRB^2). The last named pair, especially PRB^2, are very interesting metrics that will make their way into Geegeez Gold later in 2020 and I will cover them in greater depth at that time. For now, though, Gold users might look to each way percentage as a way of - somewhat artificially but perfectly legitimately - extending the sample size in question.
In terms of profitability, A/E (Actual vs Expected, more information here) is a solid barometer of ongoing value. It's a simple enough concept, where an A/E of greater than 1.00 is considered a positive, an A/E of less than 1.00 is considered a negative, and the further away from 1.00 the number, the better or worse is the expected merit. The A/E column can be found within Geegeez Gold's Query Tool, a tool that will form the cornerstone of parts two and three in this series.
Review, and Realise
Once you've found your angle(s), stored them, and started to bet them, there are two important 'maintenance' jobs to take on. The first is one of review. No matter how large or small the research sample was, every qualifier thereafter swells the knowledge base. Returning to your set of angles on a regular - maybe quarterly, but it depends how much action an angle throws up - basis is excellent discipline. Don't get too hung up on profit and loss from quarter to quarter, but rather focus on whether the horses looked likely beforehand, took a degree of support, and ran well even if in defeat.
Through this review process we start to realise - make real - the angle. A trainer becomes someone whose methods we get to know; likewise a sire, or a course profile, or whatever. We must make friends with these entities, ask questions of them, become more familiar than the market. This is a lot easier than it might sound, particularly in terms of the early markets, which are heavily focused on 'top down' information such as basic recent form, newspaper tipsters and fashionable trainers and jockeys.
'Bottom up' intel - first start in a handicap, favourable draw/pace, no name trainer with his job jockey, and the like - is factored into the market later. This late intelligence is generally underpinned by people close to yards who want to bet, and they can't get a meaningful bet on until nearer the off time. As angle punters we have to second guess them: we'll generally not nick their price, but can nab a few quid at 'ignorant odds' before the smart money arrives.
More often than this, though, are the occasions when we realise that the first flush of love was misguided; that we rushed in as fools, or maybe merely flirted dangerously with a dataset which failed to substantiate itself for the application of further evidence. Reviewing and rejecting these false dawns (no offence, Dawn, if you're reading!) is as valuable - arguably more valuable - than finding a great angle: the first job is to try not to lose money, the second job is to try to win money.
Nothing Lasts Forever
The final point to make in this overture to Angle Research is that nothing lasts forever. You will know you have found a great angle if the strike rate remains largely the same over time while the profit diminishes to a loss. That is simply a function of market awareness and is the lot of any and all statistical edges.
The game, of course, is to continually reinvent our portfolio.
Every week, month or year, there are new trainers waxing and old trainers waning. Likewise sires and, to a lesser extent, jockeys. Tracks change their drainage and, in so doing, reverse their draw biases. Surfaces get relaid and the front-running bias is mitigated as the kickback to later runners becomes less severe.
It's the circle of life, and all the joy within: there is always something else to learn, to discover, to deploy.
Evolve or die: this is the angle punter's mantra.
*
In part two of this series, which you can review here, I'll introduce you to Query Tool: what it is, where it lives, what it does and how it does it. And in part three, we'll work through a series of examples: micro angles which can be deployed as they are but, importantly, which are singular examples from rich seams whose nuggets are waiting to be extracted by the inquisitive Gold miner! 😉
https://www.geegeez.co.uk/wp-content/uploads/2019/09/optimalcomplexitytheory.jpg320830Matt Bisognohttps://www.geegeez.co.uk/wp-content/uploads/2022/10/geegeez_banner_new_170x78.pngMatt Bisogno2020-03-26 13:42:082020-03-31 19:12:41Horse Racing Betting Angles: Part 1, Research Principles
geegeez.co.uk uses cookies to improve your experience. We assume that's OK, but you may opt-out from the settings. Cookie settingsACCEPT
Privacy & Cookies Policy
Privacy Overview
This website uses cookies to improve your experience while you navigate through the website. Out of these cookies, the cookies that are categorized as necessary are stored on your browser as they are essential for the working of basic functionalities of the website. We also use third-party cookies that help us analyze and understand how you use this website. These cookies will be stored in your browser only with your consent. You also have the option to opt-out of these cookies. But opting out of some of these cookies may have an effect on your browsing experience.
Necessary cookies are absolutely essential for the website to function properly. This category only includes cookies that ensures basic functionalities and security features of the website. These cookies do not store any personal information.
Any cookies that may not be particularly necessary for the website to function and is used specifically to collect user personal data via analytics, ads, other embedded contents are termed as non-necessary cookies. It is mandatory to procure user consent prior to running these cookies on your website.