Read all sorts of commentaries and tips across a range of racing disciplines on the most popular horse racing blog in Britain, from staff and guest writers.

What about wind ops?

The pursuit of optimising ability in racehorses has stepped forward in leaps and bounds through the past decade. Training methods, pharmaceuticals, and surgical intervention have all progressed apace in the quest to squeeze every drop of talent from ever more expensive thoroughbreds.

But, from a wagering perspective, these advancements are largely hidden from sight: there is no official record of injuries; training patterns are discernible only from a deep dive into the form book; and the influence of veterinary care is entirely 'black box' for the average punter.

One vulnerability in racehorses, especially in larger ones, is a difficulty breathing when under significant pressure from exercise. Technically known as DDSP (dorsal displacement of the soft palate), it is the temporary movement of a piece of fleshy tissue into an area through which oxygen flows. In other words, it causes a restriction to the amount of air a horse can breathe in during the business part of a race. Seeing as oxygen is needed to keep the muscles working, this is a bit of a problem.

Those who raced horses historically sought to address the issue via a procedure called tubing, whereby, as the name suggests, a metal tube was placed directly into the airway allowing air to bypass the obstructed area. However, tubing became outmoded with the evolution of internal surgical procedures and, in October 2012, 'tubed' horses were no longer permitted to race in Britain.

Whilst, as usual, there were derisive howls at the time - change is always greeted in such a way in the racing fraternity (and, in fairness, in most other walks of life) - the rise and rise of the 'wind op' quickly ensured that horses hindered by breathing difficulty during racing had another potential mitigant.

There is an array of possible interventions which vary in gravity; and, until the beginning of this year, the general public had no awareness as to which horses had had surgery, still less which procedure was undergone. Happily, and partly as a result of calls from the Horseracing Bettors Forum, a group attempting to improve the lot of British punters and which I currently chair, the BHA fended off the Luddite clamour from within racing to pronounce that, from January 19th, wind surgery (in its generic form) was required to be declared at the time of entering the affected horse.

There was the usual dissent from within the ranks, including from otherwise sensible and generally cautious individuals such as the excellent Gary Moore, who proclaimed, "It will be about as much use as an ashtray on a motorbike, a complete waste of time."

In fairness, many of his peers took a more pragmatic stance, and punters (and breeders and other owners and trainers) have been aware of the vet's intervention for ten months now. Whilst the public is not privy to exactly which operation has transpired, it is generally reasonable to assume that the appropriate level of procedure for the affected animal has been undertaken.

So, ten months in, what do we know?

Let's start with the caveats. As mentioned, we don't know which procedure took place and, naturally, all procedures are not alike. So it may be that intervention A has a much higher success rate than interventions B or C. At time of writing, we must assume that proportionate action was taken and that the outcome of that proportionality across the impacted population is the same, by and large. That may very well not be a correct assumption, but in the land of the blind and all that...

Secondly, ten months into this new degree of awareness, we are still dealing with a relatively small sample size. From January 19th to November 18th there were 4,007 UK runs by horses which had had wind surgery. To be clear, that might be the first or 21st run after surgery. That is in the context of 79,861 total UK runs, which is as close to 5% of all runners being impacted by wind surgery at some point as doesn't matter.

On that point, a third proviso. I have yet to see two wind surgery data sources with the same numbers. We've done a good amount of work with ours, and I'm pretty confident that our data are cleaner than other sources I've seen; but it may very well not be precisely perfect. That doesn't really matter when looking for general patterns: this information will never be used to inform a life or death situation, but it may lead a punter to weight in favour of one horse over another. And it may not. The ultimate caveat is caveat emptor: your money, your choice. As always.

OK, scene set, what of the data?

Overall performance by runs since a wind op

Here is the overall picture, in terms of win strike rate by run number after wind surgery. Again, for the sake of clarity, 1 is first run after surgery, 2 is second run after surgery, and so on; 0 means the horse has not undergone wind surgery.

Win strike rate, by runs after wind surgery, all UK runners 19/1/18-18/11/18

Win strike rate, by runs after wind surgery, all UK runners 19/1/18-18/11/18

I wanted to start with a chart because I think it shows a quite interesting pattern, viz. the slow but steady improvement in the win strike rate of horses who have undergone wind surgery, up to their fifth post-surgical run.

That fifth start column looks an anomaly, and in the absence of any sensible theory to explain its high performance, I'm happy to ignore it as such.

Here is the tabular version, this time with other data elements presented:
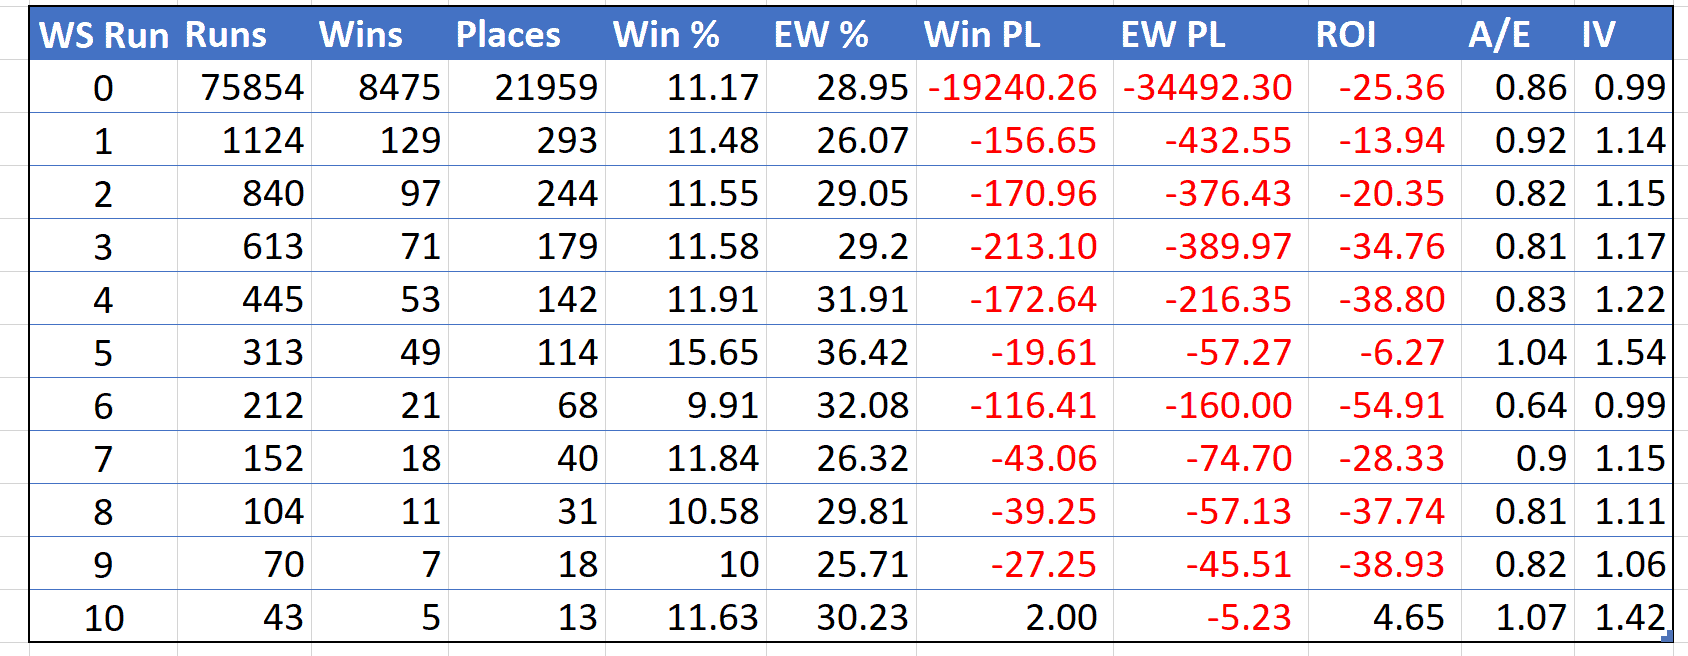
Table view of horse performance by wind surgery run, 19/1/18-18/11/18

Table view of horse performance by wind surgery run, 19/1/18-18/11/18

It may be interesting to note that, on first run after wind surgery, while the win strike rate improves, the place rate is notably lower. Again, I'm not sure whether this is anything but an anomaly, notwithstanding that there are over 1100 runs in the sample. Generally speaking, horses who have undergone wind surgery place at a slightly higher rate than whose which have not, but not necessarily on that first run post-intervention.

In truth, what we see here is that there is little more than a marginal gain overall as a result of wind surgery. But there are just about enough data to look into sub-divisions of the superset, so let's do that.

Impact of wind surgery by race code

The first cut of the data I'd like to review is by race code and, specifically, comparing flat races with jumps races. Now, check this out:


The starting point - left hand side - of the line is the control, i.e. no wind surgery for the horse. National Hunt (NH) horses strike at a slightly higher rate generally because NH races have fewer runners generally. But look how the lines diverge as they move away from the control.

The orange line, representing performance by number of runs since wind surgery in flat races, gets progressively worse and never out-performs the 'no intervention' control group during up to four subsequent starts.

Conversely, the blue line shows that the impact of wind surgery on National Hunt runners is increasingly positive up to the fourth run subsequently (and indeed beyond, not shown here).

The pattern of the data is clear but explaining it is less straightforward. My best guesses are that a) the selected interventions on flat horses are of the more cosmetic type, or at least at the lower end of the range of procedures available; and/or b) that wind surgery in flat horses is a 'desperation measure' when an exasperated - and doubtless notably less wealthy than pre-purchase - owner has exhausted all 'homeopathic' options.

I couldn't say that either of those theories is credible, and perhaps you have an alternative to throw into the mix. If so, do please leave a comment below to that effect.

Impact of wind surgery by length of layoff

One dissection which could shed some light on the severity of intervention is days since a run, the theory being that the longer the layoff the more pronounced the procedure. There are, of course, many reasons for time off, notably the changing of the seasons and summer/winter breaks (the most obvious and opportune time to intervene in this way), but it is still worth reviewing the numbers.

In this case, I am interested specifically in W1, that first start after surgery, and how it compares with horses running off a similar layoff but without ever having had wind surgery.

Comparison of flat to NH, W0 to W1, by time off course, UK 19/1/18-18/11/18

Comparison of flat to NH, W0 to W1, by time off course, UK 19/1/18-18/11/18

The above, slightly confusing, table allows for comparisons between various things. The data are broken down by race code and length of time off, and includes only horses which are having their first run post-wind surgery (W1) or which have never had wind surgery (W0). As can be seen, there are some very small sample sizes here, so additional caution is advised.

Looking first at the 'Flat W0' group - horses running on the flat which have never had declared surgical intervention - we can see that horses returning to the track within two months of their last run (Flat W0 0-60) fare a lot better than flat runners laid off for longer. That is consistently true for both win and place, the win element reflected in a positive impact value of 1.06.

Comparisons with the flat W1 group are tenuous due to the tiny samples in that set but, for what it's worth, there does appear to be a contrast, especially in the 0-60 window. Horses returning to the track within 60 days after wind surgery on the flat have significantly lower win and place percentages. The flat W1 61-120 group offers mixed messages, but using the slightly larger body of place evidence suggests that these runners are also under-performing.

But look at the longer layoff W1 flat horses - those absent for four months or more - and you'll note that there are across the board improvements on their W0 counterparts, albeit that the 180+ place numbers are the same.

If any conclusions can be drawn from that, and I am unconvinced that they can at this stage, it might be that the impact of (presumed, based on length of absence) minor wind surgery on flat horses is somewhere between neutral and negative.

With National Hunt horses, where there has been no wind surgery, we can see that the longer the layoff the less likely a horse is to win: horses backing up a run within four months having an impact value of about 1.04, whereas those returning after four to six months off drop to an IV of 0.97, and those absent for six months-plus are at 0.9 in IV terms.

Compare that high to low trend line with the National Hunt W1 runners, and we get an interesting - if less clear - pattern. Like their flat counterparts, the W1 quick returners win less often than the W0 quick returners; but, thereafter, those returning after a breathing operation out-perform those that are not.

The sample sizes are small here, and I don't think there is any confident inference to be drawn.

Impact of wind surgery by race class

Is it possible that horses running in a given race class fare better than others? Could such action allow classier horses to prevail more often, or is it more likely to positively impact low grade animals? Or does race class have no bearing?


On very limited sample sizes, it seems that there is an uplift in impact value in the better races - Class 1 and 2 - and that, otherwise, impact in terms of IV is minimal. First time after wind surgery may be worth marking up in better races.

Impact of wind surgery by race distance

I wanted to look at whether the extent of the stamina test faced by a horse, as opposed to more of a speed test, would be material from a wind surgery perspective. In the below, I've grouped all runs post-intervention as W+, and compared it with the W0 control once more. I've also broken down by flat and National Hunt, flat W+ tables first.

Performance of "W+" horses on the flat, by race distance and race distance group, 19/1/18-18/11/18

Performance of "W+" horses on the flat, by race distance and race distance group, 19/1/18-18/11/18

This is a deeply inconclusive set of figures, the comparison with W0 runners bearing that out below. That said, it may be reasonable to argue that flat horses running beyond a mile derive more benefit from wind surgery than those racing at shorter distances.


Perhaps the NH perspective will shed a little more light:

Performance of W+ horses in National Hunt races, by distance

Performance of W+ horses in National Hunt races, by distance


That's more like it. The race distance Impact Value comparison between W+ and W0 horses articulates the point more succinctly.


The blue bars represent the performance of National Hunt runners whose wind has been declared as addressed at some point. They have a performance edge, in terms of Impact Value, at least up to about three and a quarter miles. After that, the data are as inconclusive as they are sparse.


Impact of wind surgery by trainer

Some trainers are keener on wind surgery than others, though that may be on the 'off chance' it might eke out an iota of improvement rather than based on a deep consideration of the particular horse. This table shows all subsequent runs by horses since they first had officially declared wind surgery (i.e. W+).

W+ performance by trainer, 20+ runs, sorted by Impact Value

W+ performance by trainer, 20+ runs, sorted by Impact Value


As can be seen, Nicky Henderson appears somewhat selective with his use of breathing intervention, thus far at least; whereas others, perhaps notably Dan Skelton, are more inclined to tweak. In Dan's defence, plenty of his horses have run multiple times - he'd be far more of a campaigner than Henderson for example - and, furthermore, the results Skelton has achieved from his wind op runners are excellent, particularly so given his is more than twice the next biggest sample size in the set.

Looking only at W1-W4, and 15+ runs to qualify a trainer into the table, gives us this:

Performance by trainer, 1st four runs after a wind op, 15+W1-4 runners only

Performance by trainer, 1st four runs after a wind op, 15+W1-4 runners only


These tables are presented 'as is', readers invited to consider their content for themselves.

Please keep in mind that the sample sizes are tiny and have every chance of not being replicated in the future. Nevertheless, they at least offer a flavour of which handlers (or their owners) might be keenest to explore the procedural route. Further, there may be a note of caution around trainers whose overall performance is significantly better than that of their runners in this context.


Conclusions

This article contains a lot of words, numbers, tables and charts but, ultimately, very few solid conclusions.

Perhaps the most reliable takeaway is that wind surgery appears to be more effective in the National Hunt sphere than on the flat, and that there may be an increase in performance from first to second, second to third, third to fourth, and fourth to fifth runs post-surgery over jumps. Maybe also that horses returning from a 60+ day layoff (and likely a more material intervention - let us hope we have more specific information with regards to the procedure undertaken in the near future, such that we don't have to guess on this) are more likely to benefit from the W1.

Again, these are not confident inferences from the data, nor are they a route to blind profit; which solitary data element is? The key here is to understand the general impact of a factor and to incorporate it into your betting.

Blindly backing W1 or W2 or W3 or W4 or W5 runners will send you skint as sure as night follows day; but knowing that in some circumstances those runners may be expected to demonstrate a small uplift on previous performance levels is a powerful insight which can contribute to improving your bottom line.

We are a mere ten months into this project - what has happened for years can be vaguely quantified now for the first time - and there remain insufficient data to take unequivocal positions; but some clear patterns are emerging. The savvy bettor will keep them in mind.

- Matt Bisogno


p.s. this article was researched using Geegeez Gold's Query Tool. It is available to Gold subscribers as a part of your existing subscription. Moreover, all users have access to extensive notation of wind surgery on our racecards. Here is an example of a horse having its fifth run post-wind surgery. To access geegeez.co.uk racecards click here. To take a trial of Geegeez Gold, click here.

Geegeez Gold Video #4: Asking your own questions

In this fourth and final video in the series, I want to share with you our Query Tool, and specifically how you can put it to work answering the questions you have about racing.

Before that, if you've not yet checked out the first three videos, I'd recommend watching those first.

Click here for Video #1: The Success Mindset

Click here for Video #2: Become a Gold Card VIP

Click here for Video #3: Finding In's from the Reports

And now to today's video...

Early NH Season, Part 2

A few weeks ago, my last article focused on National Hunt trainers who fly out of the gates in the autumn, writes Jon Shenton.   When compiling data and researching angles for that edition there were a few other areas of interest which I’d like to touch on today.

A key aspect that was considered for the aforementioned piece was evaluating where trainers had a runner returning to the track after an absence of more than 180 days, or about 6 months.  The thinking is that some trainers will have horses wound up and ready to go after a summer absence, while others’ animals generally come on for a run, taking a long-term view of the season ahead.

The below graph shows the total volume of runners returning to the track after a layoff of that magnitude.  Clearly, now is a good time to dive into which trainers are ready to go or otherwise.  As can be seen, we are in peak season for long absence returners.

Graph illustrating number of horses returning to the track after a break of 181+ days, since 2010, by month


Bargepoles and Scary data

My general approach is to always try and provide a few pointers to find a reasonable return over the medium to long term.  However, there is definite value in identifying horses through which to strike a line: data for those inclined to lay in other words.

The first stop is what I’d uncharitably term a ‘bargepole list’. The table below comprises of trainer records in terms of horses making a reappearance after more than 180 days off the track.  50 runs is the minimum level for inclusion and I have sorted in reverse A/E, accounting for all runs from the start of 2010 onwards.


Trainer performance for all runners from 2010 where the horse last ran 181+ days previously

Trainer Runs Wins Win% P/L(SP) Place% ROI(SP) A/E
Jewell, Mrs L C 51 0 0.0 -51.0 5.9 -100.0 0
Menzies, Rebecca 52 0 0.0 -52.0 11.5 -100.0 0
Young, Mrs L J 62 0 0.0 -62.0 11.3 -100.0 0
Carroll, A W 81 1 1.2 -72.0 11.1 -88.9 0.17
Stephens, Robert 56 1 1.8 -39.0 17.9 -69.6 0.24
Newton-Smith, A M 51 1 2.0 -40.0 11.8 -78.4 0.25
Dennis, David 73 2 2.7 -61.8 12.3 -84.7 0.3
Wintle, A 57 1 1.8 -48.0 10.5 -84.2 0.31
Brennan, F J 55 1 1.8 -26.0 10.9 -47.3 0.34
Henderson, P 79 2 2.5 -63.0 12.7 -79.8 0.37
Dyson, Miss C 99 2 2.0 -71.0 9.1 -71.7 0.37
Easterby, T D 62 3 4.8 -36.3 22.6 -58.5 0.37
Thompson, V 53 1 1.9 -44.0 11.3 -83.0 0.38
Davison, Miss Z C 57 1 1.8 -36.0 10.5 -63.2 0.41
Normile, Mrs L B 67 1 1.5 -54.0 9.0 -80.6 0.43
Goldie, J S 68 3 4.4 -42.0 19.1 -61.8 0.44
Candlish, Jennie 129 5 3.9 -90.5 22.5 -70.2 0.47
Frost, J D 76 2 2.6 -37.0 7.9 -48.7 0.47
Bewley, G T 62 3 4.8 -42.8 27.4 -69.0 0.49


That’s a combined 30 wins from 1290 attempts with a A/E performance on average of 0.30.  Ordinarily I’d like to keep table data to a top 10 or so, but in this case, it felt a bit like a civic duty to share it all!

It goes without saying that if you’re backing a runner from these stables under these conditions that you need a very compelling reason to argue against the data. Obviously, it doesn’t mean that they can’t win – and horse can win any race – and, as ever, sample sizes are sub-optimal. Treating all of these stable runners with caution under these circumstances is advised.

The yards contained on the bargepole list are generally of the small/mid-range in terms of size.  Of greater interest may be to evaluate some of the household names of the game with the same conditions applied.  The table below contains larger outfits (100+ runs and not included in the first list above).  All have A/E rates of 0.8 or lower for horses where they are absent from competitive racing beyond the 180 days limit.


Trainer performance for all runners since 2010 where the horse last ran over 180 days previously (min. 100 runs at A/E less than 0.8)

Trainer Runs Wins Win% P/L(SP) Place% ROI(SP) A/E
Gordon, C 110 5 4.6 -48.1 18.2 -43.8 0.51
Webber, P R 188 8 4.3 -104.5 17.6 -55.6 0.51
Keighley, M 145 9 6.2 -61.6 22.1 -42.5 0.51
Dobbin, Mrs R 127 7 5.5 -83.0 21.3 -65.4 0.58
Williams, Ian 180 13 7.2 -72.5 25.0 -40.3 0.59
Hammond, Micky 110 5 4.6 -75.2 14.6 -68.3 0.59
Smith, Mrs S J 308 24 7.8 -104.2 26.3 -33.8 0.65
Russell, Lucinda V 332 27 8.1 -147.5 27.4 -44.4 0.66
Richards, N G 220 24 10.9 -68.5 35.0 -31.2 0.67
Hill, Lawney 120 10 8.3 -41.1 24.2 -34.3 0.67
Down, C J 106 4 3.8 3.5 17.9 3.3 0.67
Case, B I 102 6 5.9 -34.2 22.6 -33.5 0.7
Phillips, R T 115 5 4.4 -53.0 19.1 -46.1 0.71
Wade, J 166 10 6.0 -76.3 22.9 -45.9 0.72
Alexander, N W 169 12 7.1 -84.1 20.1 -49.7 0.73
Greatrex, W J 250 40 16.0 -106.7 37.2 -42.7 0.73
Wadham, Mrs L 118 13 11.0 -6.3 31.4 -5.3 0.74
Jefferson, J M* 163 20 12.3 -63.5 33.7 -39.0 0.75
Mullins, J W 175 11 6.3 -70.5 19.4 -40.3 0.76
Bailey, Caroline 100 7 7.0 -34.8 22.0 -34.8 0.77
Moore, G L 317 32 10.1 -144.1 24.6 -45.5 0.79
Dickin, R 116 7 6.0 -41.3 17.2 -35.6 0.79

*J M Jefferson yard now overseen by daughter, Ruth. It remains to be seen whether she adopts the same patient approach


A lot of these are undoubtedly considered elite level exponents of the training game.  They all will have short priced horses making their seasonal reappearance right about now.   Across the board the win strike rate is a moderate 8%.

On a personal level, awareness of this data has resulted in a modification of my betting habits over the last few weeks.  Sure, sometimes using intel such as this will leave you kicking yourself as you leave a winner out but it’s all about getting a few more right than wrong in the long-term.


Winter Sunshine

Enough with the negativity. Let’s find a few rays of winter sunshine. Using the same 180 days off the track criteria with the addition of only considering runners at an SP of 20/1 or less (to prevent one or two big winners skewing the data) I’ve curated the following, more optimistic, data set.  This time I’ve sorted by ROI: bottom line profit is the ultimate goal after all. To qualify for the winter sunshine list at least 50 runs are required, a minimum of a 10% ROI at SP and a minimum of a 10%-win rate.


Trainer performance for all runners since 2010, 180+ days layoff, SP 20/1 or shorter

Trainers Runs Wins Win% P/L(SP) Place% ROI(SP) A/E
Bridgwater, D G 98 21 21.4 53.7 41.8 54.8 1.47
Easterby, M W 51 11 21.6 24.9 35.3 48.8 1.65
Hales, A M 74 12 16.2 34.0 35.1 46.0 1.42
Pauling, Ben 100 25 25.0 37.6 45.0 37.6 1.24
Honeyball, A J 119 26 21.9 41.2 43.7 34.6 1.14
Walford, Robert 59 10 17.0 18.9 30.5 32.0 1.33
Scott, J 118 20 17.0 30.4 39.8 25.8 1.23
Symonds, Tom 64 10 15.6 13.6 43.8 21.2 1.09
Williams, Evan 339 60 17.7 64.0 39.2 18.9 1.07
Scudamore, M J 74 11 14.9 13.3 35.1 17.9 1.27
Leech, Mrs S 74 10 13.5 12.8 27.0 17.2 1.14
OBrien, Fergal 189 38 20.1 29.7 42.3 15.7 1.12
Dartnall, V R A 119 19 16.0 15.8 40.3 13.2 1.09


A much more interesting set of results for backers, all pretty positive and all worth further investigation.  As usual it’d be remiss not to have a quick dive into the most profitable on the list, in this case the Cotswolds-based trainer, David Bridgwater.


David Bridgwater runners after a break of 180+ days, SP 20/1 or shorter by year

Year Runs Wins Win% P/L(SP) Place% ROI(SP) A/E
ALL 98 21 21.4 53.7 41.8 54.8 1.47
2018 7 2 28.6 19.0 71.4 271.4 2.41
2017 3 1 33.3 2.0 66.7 66.7 1.18
2016 13 1 7.7 -7.0 23.1 -53.9 0.71
2015 25 8 32.0 15.0 44.0 59.9 1.65
2014 15 2 13.3 0.5 40.0 3.3 1
2013 20 3 15.0 20.0 35.0 100.0 1.4
2012 6 1 16.7 -2.0 16.7 -33.3 1.23
2011 6 2 33.3 5.8 66.7 95.8 2.27
2010 3 1 33.3 0.5 66.7 16.7 1.89


Judged on this criterion, “Bridgie” has clearly peaked between 2013-2015 in terms of volume. However, he still appears to get his horses primed after a layoff these days, just in lower numbers.   Perhaps the increased activity during the peak years were as a result of his stable star The Giant Bolster finishing 2nd, 4th and 3rd in consecutive Gold Cup’s at Prestbury Park, thus raising the profile of the operation.  Delving slightly deeper into the data the performance is strong in the rank and file classes of NH racing (4 and 5), with 19 winners from 70 runs, ROI of 106% at SP. That’s probably an angle to keep in the back of your mind I suspect, rather than to follow blindly.

Picking another yard in a semi-random way (as I have an affinity for them) let’s check the Ben Pauling outfit. Willoughby Court signalled a change in fortunes with regard to my woeful Cheltenham Festival record back in 2017 and I’ve been following them ever since that momentous occasion.  The expanding yard is coming off the back of its most successful season and is clearly going in the right direction.

The beauty (or one of them) of evaluating data such as this is that it can act as a gateway into a deeper understanding of a trainer, generating a different angle or view to what was initially expected.  Let me illustrate:

Pauling’s 25 wins from 100 with a 37% ROI looks overwhelmingly positive (and it is), however, here is the breakdown by month 

Ben Pauling runners with 180+ off the track at SP of 20/1 or shorter by month

Month Runs Wins Win% P/L(SP) Place% ROI(SP) A/E
January 4 1 25.0 9.0 50.0 225.0 2.08
February 4 0 0.0 -4.0 0.0 -100.0 0
May 5 2 40.0 -1.0 40.0 -20.0 1.3
June 3 0 0.0 -3.0 66.7 -100.0 0
July 1 0 0.0 -1.0 0.0 -100.0 0
October 20 1 5.0 -14.0 35.0 -70.0 0.27
November 46 13 28.3 11.2 50.0 24.4 1.31
December 17 8 47.1 40.4 52.9 237.5 2.31


Look at October in relation to November and December.  They are pretty powerful numbers (small sample small-print applies).  In fact, they’re so powerful I have the strong inclination to check all of Pauling’s runners, irrespective of whether they’ve had over 180 days rest or not.  The graph below shows the split of profit and loss by month for all of the stable’s runners at 20/1 or shorter.


Ben Pauling P&L performance by month for all NH runners at 20/1 or shorter from 2010 onwards


The first thing to say is that the trend from the 180+ data is very much a representation of the whole yard’s performance.  Backing every Pauling entry during November and December appears to be a very promising area in which to potentially invest the kid’s university funds.  The whole stable appears to go into overdrive as we get towards the dying embers of the calendar year.

As a final and potentially arbitrary step, the Pauling record in Nov/Dec with fillies and mares is very poor with just one win from 28 runs.   Checking the overall year-round performance with the fairer sex there have been a skinny 5 wins from 68 runs, losing over 70% of funds invested.  As a result, I’ll happily exclude fillies and mares from the angle: training these has unique and different challenges, so exclusion can, I feel, be justified. That leaves the overall angle performance as per the table below.


Ben Pauling November/December male runners by year with, SP of 20/1 or shorter

Year Runs Wins Win% P/L (SP) Place% ROI(SP) A/E
ALL 205 56 27.3 104.7 46.8 51.1 1.35
2018 5 1 20.0 0.0 40.0 0.0 1.75
2017 72 18 25.0 14.2 47.2 19.7 1.17
2016 56 13 23.2 2.1 41.1 3.8 1.17
2015 36 15 41.7 54.3 52.8 150.8 1.72
2014 31 8 25.8 35.1 51.6 113.3 1.57
2013 5 1 20.0 -1.0 40.0 -20.0 1.56


In summary, backing Pauling male runners in November and December at 20/1 or shorter returns 51% to SP with a healthy strike rate of over 27%.  Maybe the market is catching up and pickings have certainly been slimmer over the past year or two.   Having said that, the yard is definitely still one to keep close to your thoughts as soon as we move into November.

Another trainer from the Winter Sunshine list, this time entirely based on volume, is Evan Williams.  The Vale of Glamorgan handler has delivered 50+ National Hunt winners every year since 2010 and is on track to do so again in 2018.

There is little doubt that this is an operation that gear themselves to getting horses out fresh and ready in October and November.   Using the P&L graph again, below is the distribution.

Evan Williams P&L performance by month for all runners 180+ days off the track, 20/1 or shorter, since 2010


A nice profit has been gleaned in the focus months; unlike Pauling, however, there are other potential periods of interest. Also, whilst the Pauling yard is historically flying with all runners in months 10 and 11 there is a clear distinction in Williams’ stable between fresh and already active animals.


Evan Williams Oct & Nov runners by month from 2010 by days since last run, SP 20/1 or shorter

Days since LR Runs Wins Win% P/L(SP) ROI
180 days or less 456 78 17.1% -84.0 -18.4
181 days or more 190 45 23.7% 84.4 44.4


As a result, we only want to consider the fresh horses from the yard, even though performance for the other horses is far from terrible.

If we want to sharpen up further, the trainer hasn’t had a victorious horse at odds of greater than 16/1 from 11 runs in this dataset.  There might be a big one out there though, as always, it’s personal choice in terms of appetite for risk and reward.

In summary, backing all Williams charges with over 180 days off the track in Oct/Nov at 16/1 or less would yield 53% at SP, delivering £95 profit from a £1 level stake.

I’m fully aware that October is in the rear-view mirror in 2018.  However, this year the stable was exceptionally quiet during the month in terms of qualifiers, finishing with a record of 0/5.  My guess would be that the exceptionally dry summer and autumn may be pushing this (and other) yard’s general routines back a few weeks, patiently waiting for winter ground.  If that is the case, then Team Williams may burst into life as the squad start hitting the course over the next few weeks.

Obviously, it doesn’t always work like that, it’s just part of the evolving punting puzzle that we all know and love.

Good luck!

 - Jon Shenton

[REPLAY] The Racecards & Form Tools Web TV Show

Last night, I broadcast the second in a series of four web TV shows. The quartet aims to help geegeez.co.uk readers - now viewers - get to grips with the power housed inside Geegeez Gold. And, also, to improve as punters in a more general sense.

The first one, recorded last Sunday evening, was on the general approach to betting and can be watched here.

Last night's show is viewable directly in this page from the link below. In it, I cover:

- Racecard icons and customization
- When to use the breeding/sales icon
- What to look for with the trainer icon
- How H2H can help understand the 'hierarchy of the herd'
- How to slice and dice trainer, jockey and sire performance history
- Proximity form as an alternative to finishing position
- Setting up Instant Expert, and the limited data red box trap
- Pace, especially setups to be aware of
- Draw on the all weather, and those advantaged and disadvantaged
- and a fair bit more besides

It's bang on 90 minutes long, and you don't need to watch it all in one sitting; but I recommend you watch it. I think it will improve your understanding of our awesome Gold toolkit. Click the video below and take notes!

Matt

p.s. you can use the full screen 'square' icon bottom right on the recording to increase the size of the video box.


NH Season Fast Starters

As I’ve alluded to in previous articles I would consider myself more of a flat game specialist, writes Jon Shenton.  However, with the onset of winter and the monumental battle of wills around when to put the heating on, perhaps you could argue that my timing is less than impeccable in terms of becoming a contributor to Geegeez.

Data are data, though – and in some ways the fact that I’m not invested so much in the history, the characters and the equine stars of the show arguably means I can be more objective about what I’m looking at.  In other words, the data can speak for themselves.  Every day is a school day and I’m hopeful that I can build some profitable and interesting angles to keep things ticking over during the cold, dark months when I’m wrapped in a blanket because I’m too tight to fire up the boiler!

In this article, I will try to unearth a bit of early season value with regard to the winter game.  That said, and as a starter concession, I still can’t work out officially when the National Hunt season starts.

As ever a reminder that analysing past performance is no guarantee of future spoils; but, as a minimum, it should help in generating ideas and approaches for evolve our knowledge and therefore our betting skill.

Let’s start with a broad-brush approach evaluating National Hunt runners by trainer during the months of October and November.  This time all the data have been crunched using the Query Tool on this very site, any runners on or after 7th October 2018 are not included.

All National Hunt runners with an SP of 20/1 or shorter by trainer in October and November from 2012 onwards

The table above displays trainers ordered by the best return on investment (ROI) at starting price (SP).  Encouragingly, there are nine of them returning over 10% without diving any deeper.

Top of the tree and first cab off the rank is Henry Oliver, the Worcestershire-based trainer who is returning a very substantial 61% over the period in question: it’s stating the completely obvious but that’s worth more than a quick glance.   First stop is to check the context of this apparent seasonal bounty, it may be that Mr Oliver is an all year-round cash cow.

All Henry Oliver National Hunt runners with an SP of 20/1 or less from 2012 onwards

If you backed every Oliver NH runner from January 2012 you would have a neat 5% return to SP with 90 winners from 534 bets.  Not quite ‘cash cow’ status but there are certainly worse ways to put your money on the line.  The below graph shows how the 26.7 points of profit is split by month.

Monthly P&L to a £1 level stake for all National Hunt runners at 20/1 or shorter from the Henry Oliver stable from 2012 onwards


First thing to note is that, like a number of NH trainers, the summer months are fallow for Oliver’s charges.  December aside, Oliver is operating at a profitable level over the winter months and I wouldn’t put you off tracking all stable runners over the core NH season so certainly a trainer to follow.

However, we started searching for early season value and clearly November sticks out like Brian Blessed playing hide and seek, returning 94% profit to ROI.  The 20% October ROI is worth noting, too.

Trying to dive deeper into those autumnal runners, evaluating variables such as obstacle type, race class, horse age or date of recent run doesn’t generate anything of real material value.   If you’re nit-picking, Oliver’s horses are 0/11 for runs greater in distance than 2m 6f in those months and 5/58 overall, something to keep an eye on.

The last metaphoric hurdle is to understand the consistency aspect of the performance.

The table below shows Oliver’s October/November runs by year.  Maybe a little streaky but scintillating performance in 2013, 2015, and in particular 2017, with a bit of a washout in 2016.  Only one losing year though (excluding 2018 thus far for hopefully obvious reasons) means that this is solid enough to go on the list!

All Henry Oliver National Hunt Oct/Nov runners with an SP of 20/1 or shorter from 2012 onwards

Suggestion: Back all Henry Oliver runners in October/November at 20/1 or less


The second luminary of the list is Fergal O’Brien, who quite simply has the best (in my opinion) and most entertaining twitter profile of all of the trainers, well worth a follow (@FOBracing) if you’re active on that medium. The stable contains relative household names such as Chase The Spud, Cap Soleil, and their first Grade 1 winner Poetic Rhythm to name but three of them.

There is no doubt the yard has impressive credentials and performance has been very strong over recent years.  If you backed every single stable runner at SP from January 2012 you’d walk away with 3.7% more cash than you invested.

I think there are angles aplenty when it comes to O’Brien, most of which are for another day but with specific reference to the early season view there are a couple of options to home in on for profit. The first is National Hunt race code

All Fergal O’Brien Oct/Nov National Hunt runners with an SP of 20/1 or shorter from 2012 onwards by race type

All profitable, which is nice. The pertinent angle for me though is his performance in bumpers, where O’Brien has nearly double the volume of winners than expected with a 186% return to boot.  Yes, the sample size is small, but within the data there are ten winners from horses making their debut (from 22), indicating that the yard gears up to get quality horses (or horses ready to win) out on the track in the months of October and November. Generally speaking, the later in October, the better as the record is 1/11 from the 1st-16th.

Profit in relation to hurdles and fences is quite small over those two months; however, if we zoom in a little closer there is a quite telling split in monthly performance, again it looks like the stable is peaking in November.

All Fergal O’Brien Oct/Nov Hurdle & Chase runners with an SP of 20/1 or shorter from 2012 onwards by race type

It’s not an absolute rule, and certainly doesn’t mean that a horse on the track on the 1st November is in different shape to one on 31st October, but it does indicate generally that as we start heading towards the big November Cheltenham meeting, the O’Brien yard picks up pace and is a definite one to follow closely.

Suggestion 1: Back all O’Brien NHF runners in late October/November at less than 20/1 SP

Suggestion 2: Back all O’Brien Chase and Hurdle runners in November at less than 20/1 SP


Moving to the trainer in the bronze medal position in the opening table, Harry Whittington: the Lambourn-based outfit is growing rapidly, currently housing nearly 50 horses with an increasing number of runners per year. I like these yards that are growing, it often means they’re on an upwards trajectory and are worth closer review.

First port of call is checking the race type in the table below, a small number of runners but the bumper aspect doesn’t look entirely compelling so I’m happy enough to exclude and keep a watching brief.

All Harry Whittington Oct/Nov National Hunt runners with an SP of 20/1 or shorter from 2012 onwards by race type

Again, evaluating the profile of Whittington’s hurdle and chase runners across the whole year gives an interesting picture in terms of P&L.  The graph below shows that very same P&L by month to a £1 level stake, it’s fair to say that Q4 looks quite compelling – another yard that’s fast out of the blocks for the new season.

Monthly P&L to a £1 level stake for all National Hunt runners at 20/1 or less from the Harry Whittington stable from 2012 onwards


If we analyse the October to December runs in terms of race class as a differentiator there is a further shard of light to assist profitable punting.

All Harry Whittington Oct-Dec Hurdle and Chase runners with an SP of 20/1 or shorter from 2012 onwards by race class


The basement C5 races are easy enough to ignore in punting terms, most of them crossing over with the NHF group we already discounted; the Class 1 & 2 are less straightforward, particularly if the yard’s expansion means they may be knocking on the door of the higher echelons of the racing ladder. Here and now I’d be inclined to back the C3 & C4 horses and track the C1/2 runners for signs of improvement or add to a shortlist to back on their relative merits.

Suggestion: Back all Harry Whittington’s October, November and December Chase/Hurdle runners at less than 20/1 in Class 3 or 4 races.


The final trainer I’m going to run through from the initial table is Venetia Williams, largely due to her volume of runners: to deliver a 17% ROI across 440 runners in the months of October/November from 2012 onwards is impressive and merits closer scrutiny.  That’s not to say all of the other trainers are not worthy of further investigation and I’d definitely be inclined to sharpen the focus on Messrs Pauling and Keighley in particular.  Have a play on QT yourself and maybe post anything of interest (or otherwise) in the comments below.

Returning to Venetia Williams, the Grand National-winning trainer has a profitable record during the months in question, but the below table tells a stark tale.  Clearly, Williams has a knack for getting her cavalry of chasers ready early in the season

All Venetia Williams Oct/Nov National Hunt runners with an SP of 20/1 or shorter from 2012 onwards by race type


Again, if we look specifically at the month, the record in November is much stronger than that of October.

Perusing the “Venetia” page at her website www.venetiawilliams.com the following sentence caught my eye:

“Since then Venetia's career has flourished. Never one to expose her horses to the high risk of summer ground, each year Venetia can be seen with the big Saturday winners during the core NH season”

There is a common belief that Williams’ runners love soft turf, and the statement above also seems to indicate a preference to avoiding the risks associated with summer ground.  On Geegeez we like facts to back up a theory, so the table below shows Venetia’s chase runners in November by official going.

All Venetia Williams Chase runners in November with an SP of 20/1 or shorter from 2012 onwards by official going


While there is confirmation that Williams’ runners prefer a softer surface, it is worth noting that the stereotyped ‘hock deep’ runner from this yard fares less well than those encountering merely ‘winter ground’, i.e. good to soft or soft.

There is one mild concern with the overall angle though, namely 2017 performance, showing a loss of 28%, this is also on the back of a moderate 2016.  It could be this angle has run its natural course, albeit I will be adding it to my own armoury this November.  Williams had a very quiet spell last winter, alluding to a potential problem in the yard so I’m just about happy enough to strike a line through 2017.  This is one for keen observation though.

All Venetia Williams Chase runners with an SP of 20/1 or shorter from 2012 onwards on good to soft, soft or heavy ground by year

Oh, and incidentally the Saturday assertion in the quoted sentence does have a degree of credence too.

Suggestion: Back all Venetia Williams November Chasers on Good to soft or softer ground with a 20/1 or less SP (with caution)

- Jon Shenton

[REPLAY] The ‘Getting Started’ Web TV Show

The Laughing Gnome or Richard Johnson after nine cups of coffee..?

Last night I presented a live broadcast via the wwww. (wonderful world wide web).

It was about 'getting started'.

Actually it was about a lot more than that, and doubtless has some value regardless of where you're at with your betting and/or whether you're a geegeez subscriber or not.

It runs for 90 minutes but you can watch the whole thing in 45 minutes to an hour...

You see, I'm not used to doing this sort of thing, and one observation I have of myself is that my delivery was probably marginally slower than ideal.

Happily, youtube has this covered with a 'speed' control bottom right [click the little cog wheel to access the control].

Here, you can choose to watch me at 1.5x (where I sound like Richard Johnson on a caffeine high) or even 2x (where I invoke the spirit of David Bowie's Laughing Gnome)... or good ol' normal speed, where I sound like me, only a bit more nasal (seasonal snots, sigh).

The show covers:
- "The Art of the Possible"
- Mindset
- Staking
- Time
- Overwhelm
- "The process"
- and an overview of the Geegeez Gold platform

And you can watch it below.

p.s. this is your LAST CHANCE to get the discounted Winter Gold season ticket, OR annual discount, OR trial month then current monthly price. From Wednesday morning, the offer is closed and the monthly cost rises for anyone not already locked in to existing pricing structure.

Don't say you weren't warned! Here's the link to get in before the doors close.

Geegeez Gold FAQ

Here at geegeez.co.uk we have a premium service called Geegeez Gold. This post is dedicated to trying answer as many of your most frequently asked questions as I can think of. If I've missed one, either add a comment below or contact me and I'll add it in. Straight in, then, with the most obvious...

Q. What is Geegeez Gold?

A. Gold is a comprehensive service for people who bet on British and Irish racing. It includes racecards, form tools, reports, tipping, a tracker, query tools, and more besides. If you bet on racing in Ireland or the UK, Gold has something to help you do it better, regardless of how you bet.

Q. What happens at the end of my Gold trial?

A. If you decide take a trial rather than the bargain 'season' tickets, once your trial finishes, you will automatically be billed the monthly subscription. You may of course cancel at any time, including during your trial. And remember, the subscription rate you sign up at will be the rate at which you're locked in for as long as you remain a subscriber, regardless of future price rises.

Q. What if I forget to cancel?

A. It happens. We're all busy. If you forget to cancel during your trial period, contact us within the first month of full subscription and we'll arrange a refund of your payment (assuming you haven't been using the service, of course).

Q. Where do I start with Geegeez Gold?

A. Gold is a comprehensive package. It's designed that way. For some, it can be difficult to know where to start. The answer is different for everyone. The most sensible place to start is to pick up where you left off with whichever service you previously used.

For example, if you like to receive tips, then start with Stat of the Day, posted on site (and accessible from the home page) around 6pm each night before the next day's racing. Then check out the tipping threads in the forum, and check in on The Shortlist report (accessible from the reports menu).

If you're more interested in form, check out our racecards - and all of the content hiding behind the icons. Then take a look at the tools - Instant Expert, Draw and Pace, as well as Full Form Filter. Then get stuck into the Query Tool.

Or if you're just looking for a couple of interesting horses, use the reports. The Shortlist is a simple one with which to get started, but the real 'juice' can be found reports like Trainer/Jockey Combo, Handicap 1st Time, and Trainer Change reports (amongst others). It is well worth checking out Report Angles, too, once you're up to speed with our reporting suite.

The important thing is to take your time, and not to try to 'reinvent yourself' overnight.

See how we have enhanced the things you already do and use when betting, and build from there.

Q. Is there training for Geegeez Gold?

A. Yes! We have a range of Gold tutorials in your My Geegeez area. Also there, you'll find a 'READ THIS FIRST' link. Obviously, I recommend you read that first!

Then, make sure you check out the User Guide, also linked from My Geegeez. That's a big document these days so I'm not expecting that anyone will read it from cover to cover; but if you're using a new feature, flick to the relevant section to ensure you're 'doing it right' and that you're not missing anything.

Finally, we have our Gold Playbook. This is a series of videos and blog posts showing specific strategies and tactics for using various elements of the Gold toolkit. Oh, and I write on the blog every few days with further pointers.

Again, take your time with Gold. "Only fools rush in", as Elvis once wonderfully warbled. There's no rush.

Q. What if I get stuck?

A. If you've checked out the various help features and/or you don't know where to look for an answer, drop us a line! Chris, Steve and myself are always happy to help people get the best out of Geegeez Gold. And, unlike some faceless racing bureaucracies, we're real people who really care about your racing and betting enjoyment and success. So do get in touch whenever you need to. Our contact link is here.

Q. Can I join in on the forum?

A. Please do! We welcome new users introducing themselves and getting as engaged as they wish on our Gold subscribers' only forum. We have just two simple rules, to which we expect everybody to adhere: no pitch, and no bitch. So please don't be selling stuff (yours or someone else's) and please be nice.

Happily, everybody on our forum aligns with those basic principles which makes it a pretty friendly place to hang out. There is also some excellent tipping going on there, and some brilliant ideas and angles being explored. We'd welcome your involvement. Here's the forum link, which can also be found from the top (red) menu bar.

Q. What else do I need to know about Geegeez Gold?

A. geegeez.co.uk is an independently run site, designed and built by racing bettors for racing bettors. All of the writers and developers, and the creator, bet regularly on horse racing. As such, we 'get' what people want. (We also get that because I regularly survey subscribers asking how we can add more value).

We don't have the mega brand of the big boys, but nor have we sold our souls to bookmakers. This is a site where punters win, as simple as that. Our tips are winning tips, where subscribers can actually get on at the prices; our ratings work, because they're not so over-exposed as to be factored into the market as soon as they're published; our tools look at form differently - and more deeply - providing insights not available to the market as a whole.

We do things differently at Geegeez. We do things better.

And we're not going anywhere. geegeez.co.uk has been online since 2008, and has over 30,000 email and website subscribers. The number of Gold subscribers is growing by the week as word is getting out about our superior features. I'm very proud of the community feel at geegeez.co.uk, and of the 'best in breed' product we've built for people, like you, who bet on British and Irish racing.

When you join us, you are becoming part of something worth being a part of. Now that's refreshing, wouldn't you say? 😉

Q. What is the best deal?

A. Geegeez Gold is priced to be accessible to anyone who has even a vague interest in making a profit from their betting - and enjoying the process. But it is a premium product, (favourably) comparable to services which currently cost more than £100 a month. We charge £36 a month, which is a third of the price of those other, more clunky (but still decent) services.

An annual subscription is the best value, users benefiting from two free months per year (£360 annual rather than £432 - remember, other similar services charge more than £1,250 for a year's sub!)

Finally, if you're not sure whether Gold is for you, take a one month trial for £1. If you love it, you'll roll onto a monthly (or annual, if you selected that option) subscription at the end of your first month. Obviously, you may cancel at any time; and if you forget, drop us a line and we'll help you out. No dramas.

So what is the best deal? They're all excellent value as you can see, but the very best value is reserved for those making the longest commitment.

Q. Help! My question hasn't been answered!

A. No problem. I've tried to cover just a few of the high level questions in this post. There will be many more I've not answered. Please leave a comment and/or drop us a line if you need another question answering - we're here to help.

For now, thanks for taking time to read this page, and good luck.

Matt Bisogno,
geegeez.co.uk


Educating Trevor: Shopping for Value

As a retired gentleman Trevor likes a bet; in fact I first met him in a Bookmakers shop around ten years ago, writes Mark Littlewood (@SmarterSig). He wasn’t a profitable punter but his daily walk into town for a bet, some banter and a cup of tea was a regular ritual. Trevor has one quality however that bookmakers do not like, he has a brain in his head. He demonstrated this by expressing to me an interest in becoming more successful with his betting.

How many punters have you met who seem to want to validate their own failure rather than improve their own betting? Trevor was not one of them and he was about to take his first steps towards profit.

He first asked me what the single most important thing was he could do to improve his bottom line, how could he at least perhaps break even and maybe even win long term. I asked him how he bets, what is his daily routine.

It is a familiar one to us all. He makes his picks around 8am, has some breakfast and then strolls into town around 10am to his favourite bookmaker which at the time happened to be Paddy Power. It sometimes changes, if the manager makes him unhappy for some reason. He will then switch to Ladbrokes, Coral, Fred or Hills. If there is one thing FOBTs have given punters it is more shops to choose from, but it is probably the only thing. Trevor will write out his bet taking the odds the bookmaker is currently offering at around 10.30am.

So what can Trevor do that will improve his bottom line. Study more form?  Follow a tipster? Invest in some fancy speed figures and follow them? My first line of advice was none of these. What all punters should do to improve their betting is to take the best price available.

I suggested that Trevor checked which bookmaker has the best odds amongst his bookmakers and make the effort to grab those prices.  If he could include online bookmakers then his prospects would be even better.

Trevor managed to do this (although not via online books) and admitted that he felt better off financially. The second thing I got Trevor to do was check out Betfair and once again Trevor was not only open to this idea but came back to me amazed at some of the prices he was getting.

Okay, so far this is all anecdotal although I can assure you perfectly true.  The real question is how much better off is Trevor and could he do even better with his bet placement choices? To test this I gathered 10:05 am prices for all High Street and online bookmakers for a period of just over two weeks starting around the St Leger meeting. I wanted to see how better or worse off the profit would be with various bet placement strategies. First of all I wanted a baseline to compare to. I decided on profit and loss to bookmaker SP on all horse who had a 10:05am average price of less than decimal 10.0 (9/1). To keep things simple I only considered races where, from 10:05am onwards, there were no non runners up to race off time. Both Flat and NH were analysed. 


AM av’g Price < 10 in betting to bookmakers’ SP £1 bets

Bets                                 PL                    Returns to £1

1236 -£87.35 £0.93


From the above we can see that during this period if we had 1236 £1 bets we would have lost £87.35 which equates on average to getting 93p back for every pound bet. What we would really like to see from a betting strategy is that last column to be above £1.00; the purpose of this article is to see which method of bet placement moves us closer to £1.00 when betting blindly.

So how can we improve matters before we even consider how we are picking our bets? Well what if we do what Trevor is now doing. What if we bet at best 10:05am prices rather than bookmakers’ SP. The first question is, which bookmakers should we realistically consider? Trevor is not going to have accounts with every available checkable bookmaker.  Perhaps a look first at betting to best price at 10:05am with the main High Street shops, namely Ladbrokes, Coral, Hills, Fred and Power.


AM av’g price < 10 in betting to best 10:05am price with main high street firms

Bets                                 PL                    Returns to £1

1236 -£77.71 £0.94


Excellent, a small improvement: a loss of £77.71 which equates to a return on every pound of 94p.

However what if Trevor is willing to really do the leg work and open accounts with all online Bookmakers? For these results I have excluded all exchanges except Betfair exchange and Betfair Sportsbook.


AM av’g price < 10 in betting to best 10:05am price with all firms

Bets                                 PL                    Returns to £1

1236 -£30.95 £0.97


It is worth noting that we will need larger samples than this to feel confident about whether that £0.97 is a realistic figure but what we are really interested in at this stage is the relative behaviour of these numbers. Is one strategy is better than another and, if so, by how much?

Let us be a little more realistic. Trevor may not want to have over a dozen online accounts. Perhaps he is only prepared to open two or three. The question now becomes one of which two or three bookmakers should he open online accounts with. A count of how often each bookmaker is top priced or joint top priced on a race should tell Trevor where to have his two or three accounts. The chart below shows this count for the period under examination.


The above chart suggests Trevor should have accounts with BetVictor, Betfair and Bet365 in addition to his high street shops

Let us now take a look at how Trevor would have performed if he took the easy option and simply placed all the bets at Betfair SP. This can be done with a single click in the morning and then the rest of the day is his.


AM av’g < 10 in betting to Betfair SP after 5% commission deducted

Bets                                 PL                    Returns to £1

1236 -7.13 £0.99


Betting all horses with a 10:05am average price less than 10.0 in the betting at Betfair SP produced a negligible loss of £7.13, which equates to a return of £0.99 for every pound invested. Once again I emphasise that this small loss is unlikely to uphold but the difference in performance from the other approaches is what we are interested in and there appears to be a clear disparity.

Furthermore, any regular punter on Betfair will not be paying the full 5% commission.

Many people will be surprised to find that the easy Betfair SP option outperformed all the other scenarios. Moreover, there is no chance of you getting your account restricted or closed betting to Betfair or Betfair SP. Seems that the old adage of "don’t work hard, work smart", applies to your betting as well.

Finally are there any bookmaker-based betting approaches that can beat Betfair SP? Well, so far there is one but it would rely on getting Best Odds Guaranteed (BOG) with any of the High Street Bookmakers at 10:05am. Where BOG is offered on a race you can take a price and if the SP is bigger your bet will be settled at the bigger price. There are some challenges with this as various time caveats come into play when offering BOG; and, more materially of course, it is the first thing to go when you show any sign of intelligent punting. Still, the results are solid for as long as one can sustain them.


Av’g price < 10 in betting to best high street only and BOG at 10:05am

Bets                                 PL                    Returns to £1

1236 +44.83 £1.04


If you are not a long term winning punter then these figures suggest that when and how you bet can make a major impact on your loss figures.

What if you are a winning punter? Unless the current bookmaker climate changes you may well be forced onto Betfair anyway, but in the meantime I would advocate placing small breadcrumb bets on Betfair alongside your normal bets to gauge the difference in overall performance.

If there is interest in this article I will follow it up with a look at whether the intelligence of the market or wisdom of the crowds can be harnessed to produce a profit.

- Mark Littlewood


Chasing A Winter Profit

Winter is coming

About a week ago I was thinking about topics to turn my hand to, playing with possible angles and messing around with data, writes Jon Shenton. Given that winter is coming™ I was looking through general National Hunt stats and I stumbled across the below potentially revelatory information.


All chase runners with an SP of 20/1 or shorter by trainer (from 1st January 2012 to 8th September 2018)

All chase runners with an SP of 20/1 or shorter by trainer (from 1st January 2012 to 8th September 2018)


The data is sorted by ROI at SP and only includes trainers that had 100 or more runners over fences in the review period.  Summarising all of the data, that’s 4890 runs in total with a decent £812 profit at a £1 level stake - a return of 17%.  To be honest I pore over data constantly and I can’t remember seeing anything this blatant, immediate and maybe obvious before, in fact I’m kicking myself I hadn’t clocked it previously. My only partial defence is that I have a slightly odd penchant for a class 6 Southwell AW handicap as a betting medium, clearly I should widen my focus to the chasing game!

Just before we plough on, let me explain the 20/1 upper limit choice: in basic terms, when looking for angles, quite often you can find what appear to be mightily profitable paper systems, but they are skewed by one or two big winners.  Now, one could reasonably argue that they are a component of the angle, however, I prefer to look for good solid reliability and hopefully sustainable profit, especially when trying to get a handle on a large data set such as ”all chase races” as we are reviewing in this article.

Back to the data, there are plenty of familiar names involved and also as you might expect, plenty of smaller yards potentially flying under the radar. In theory backing all runners from all of the yards systematically may yield a return but underneath this high-level view there should be interesting pockets of gold where a sharpened focus could improve the yield.

So how can we zoom in?  Well we could just analyse each trainer individually and sequentially, hunting for micro angles.  Maybe if we have unlimited time that would work but I have deadlines to meet, bills to pay, a family to talk to and a day job to think about.

I think in this case a quick look at consistency of performance over each calendar year may give a better view of the trainers to follow in the chase field. The table below gives that summary, blatantly and unashamedly ripping off an Instant Expert type view to assist in landing the individual nuances in the data.

P&L performance by year for a £1 level stake by trainer (All chase runners with an SP of 20/1 or shorter by trainer (from 1st January 2012 to 8th September 2018)

P&L performance by year for a £1 level stake by trainer (All chase runners with an SP of 20/1 or shorter by trainer (from 1st January 2012 to 8th September 2018)


First thing to note, 2018 as a whole so far is certainly disappointing in comparison to previous years.  It may be seasonality, i.e. we are only part way through 2018 and perhaps a number of these trainers hit their straps in Q4 so there could be juicy profit to be had over the next few months. It may be that the market is now wising up to the yards’ chasing proficiency. It may be reversion to the mean. It may be that the dataset was happenstance in spite of the 100+ runners stipulation. Or It may be something else entirely!

The original reason for pulling that view of the data was to find trainers upon which to focus; to look for those with a high degree of consistency both in strike rate and profit. We’re not really interested in flash in the pan performance: for instance, we can see that Kerry Lee makes the list purely on the back of a Hollywood 2016.

All of the trainers in the table with a comment of either “Consistent” or “Improving” are worth prioritising in the first instance but, for the sake of brevity, I’m going to concentrate on three: Dai Burchell at the top of the list, Michael Scudamore and Nigel Hawke.  Perhaps I’ll visit some of the others in a future edition!


Dai Burchell

I have a confession to make. Until starting this research I had genuinely never heard of, knowingly backed, or even looked at a Dai Burchell horse. I follow the flat more closely than the jumps – that’s my excuse – but even so!  Anyway, for those in the same hitherto ignorant boat as me, the yard is based in Ebbw Vale, has around a dozen horses in training currently and has been operating since 1983.  Dai and I have something in common too: apparently, we both enjoying walking around castles, perhaps our paths have crossed before unwittingly.

A keenness to learn more about Burchell reveals he is clearly a chase specialist, his hurdle strike rate being less than half as good. The yard’s sole bumper runner barely merits mention.


Dai Burchell National Hunt Runners by race type (from 1st January 2012 to 8th September 2018)

Dai Burchell National Hunt Runners by race type (from 1st January 2012 to 8th September 2018)


As I’ve mentioned in a previous article one of the first things I check where a trainer is concerned is how their fleet perform after a layoff. The table below shows Burchell’s chase runners split by days since last run.


Dai Burchell Chase Runners by days since last run with an SP of 20/1 or less (from 1st January 2012 to 8th September 2018)

Dai Burchell Chase Runners by days since last run with an SP of 20/1 or less (from 1st January 2012 to 8th September 2018)


If a Burchell horse hasn’t had a run in 76 days then it doesn’t win. Granted there are only 18 of them so not a reliable number but the fact that the place percentage is also lower than the rest of the sample I’m happy enough to ignore it, leaving us with the following.


Dai Burchell Chase Runners at less than 20/1 SP with a run within the last 75 days (from 1st January 2012 to 8th September 2018)

Dai Burchell Chase Runners at less than 20/1 SP with a run within the last 75 days (from 1st January 2012 to 8th September 2018)

A 24%-win rate and 78% ROI by backing all Dai Burchell chase runners if they’re fit (i.e. ran in the previous 75 days). Ordinarily I’d take that any day of the week, but there is a very substantial elephant in the room that needs addressing. This is a small yard and this seemingly bulletproof performance is down to a small number of horses winning multiple times.

In fact, if we look at the 34 winners we have only 11 unique horses accounting for them, with such luminaries as Rebecca’s Choice, Ratify and One For The Boss getting their noses in front a total of 15 times between them.  There have been only 16 individual horses running for the yard since 2012 so to have 11 different winners is a strong performance, but even so it does make the data evidence slightly less compelling.

Having said that, what we know for certain is that Dai Burchell has a small, highly effective unit of chasers, who can win on a regular basis. They’ll certainly be going in my tracker or angles to flag each time they run for deadly serious consideration.


Michael Scudamore

Let’s look at one of the more mainstream names, the Welsh National and Cheltenham Festival-winning trainer MJ Scudamore, who has horses such as Mysteree and Kingswell Theatre associated with the yard.  My eye was drawn to this trainer on account of a profitable return in each of the last four years – significantly so in each of the last three years – and look to be on an upward curve, at least at first glance.

As with Dai Burchell, the record of Scudamore runners in chases is far superior to hurdles and NH Flat: his hurdle strike rate is 9%, less than half of the chase equivalent. The hurdlers also have an ROI of -60% compared to the 27% profit on chase runners.

Digging deeper into the record over fences there is a great deal of consistency across the usual factors I’d initially use to home in (days since last run, race class, horse sex, age etc).  There is, however, one area which merits attention.


MJ Scudamore Chase Runners at 20/1 or less SP by month (from 1st January 2012 to 8th September 2018)

MJ Scudamore Chase Runners at 20/1 or less SP by month (from 1st January 2012 to 8th September 2018)


The above graph clearly shows a fallow period through the summer jumps period, which is perfectly understandable: the yard keeps ticking over, but the focus is seemingly to gear up for the main season over the winter months.  The strike rate trend is mirrored by profitability, April to September runners collectively delivering a yield of -9%.

If we take Scudamore chase runners from October to March we’re left with a nice return of 64% at SP (78% Betfair Exchange).  The yard certainly has a bigger scale than Burchell with 46 horses in training, according to scudamoreracing.com.

Again, the 42 winners include multiples, with 18 unique horses delivering them.

One final thought on this section relates to recency bias. Very often when churning through data (trainer data especially) one check I do is to differentiate between whether a horse placed last time out.  For some trainers form of the horse can be less relevant, they are better at bouncing back from more moderate runs (maybe as they drop down the handicap). Below shows the differential for the Scudamore chasers through the winter months.


MJ Scudamore Chase Runners at 20/1 or less Oct-Mar by whether they placed LTO (from 1st January 2012 to 8th September 2018)

MJ Scudamore Chase Runners at 20/1 or less Oct-Mar by whether they placed LTO (from 1st January 2012 to 8th September 2018)


No discernible difference in strike rate but the P&L is much healthier for horses that didn’t hit the frame in their previous run. The average SP for a winning horse placing LTO is a shade over 10/3, whereas for those off the board on their most recent run, the winners return an average 15/2 SP. Recency bias in numbers? I hope to review this in more detail over the coming months.

Recency bias or not, don’t be put off by a recent moderate run by a Scudamore chaser.


Nigel Hawke

The final trainer subject to a more detailed review is Nigel Hawke, who is based in Tiverton and has a team of nearly 30 horses in training. Whenever I hear or think about Nigel Hawke the first thing that springs to mind is geegeez.co.uk’s Trainer Snippets report, specifically with regard to last time out winners. Hawke’s name seems to be a permanent fixture on there! So, first port of call is to check that and, given his general strong record over fences, I’d expect to see a nice angle looking specifically at LTOW’s.


Nigel Hawke Chase Runners at 20/1 or less SP where they won LTO (from 1st January 2012 to 8th September 2018)

Nigel Hawke Chase Runners at 20/1 or less SP where they won LTO (from 1st January 2012 to 8th September 2018)


Sure enough, the theory holds water: a small number of runners but solid enough. As a slightly off-topic bonus, below is the record of Hawke’s LTO winners running over hurdles over the same period, a very similar story.  Conclusion: Nigel Hawke last time out winners are worth backing irrespective of obstacle type


Nigel Hawke Hurdle Runners at 20/1 or less SP where they won LTO (from 1st January 2012 to 8th September 2018)

Nigel Hawke Hurdle Runners at 20/1 or less SP where they won LTO (from 1st January 2012 to 8th September 2018)


Back to Hawke in general chases, here is his record by class of race


Nigel Hawke Chase Runners at 20/1 or less SP by race class (from 1st January 2012 to 8th September 2018)

Nigel Hawke Chase Runners at 20/1 or less SP by race class (from 1st January 2012 to 8th September 2018)


As can be seen, Class 5 – the basement level in National Hunt – race performance is fairly wretched by comparison to all other classes.  I’m always comfortable taking these factors into account when it’s either at the elite end or the opposite (let’s call it grassroots) levels.

By focusing on Class 1 to 4 races only we are left with 46 wins from 212 runs (21%) and a starting price ROI of 44%, the 46 wins delivered by 19 different animals.


Summary

There are a number of generally profitable trainers over fences in the review period and using a quick check of consistency to zoom in on particular yards, I would flag three angles worth putting in the notebook for the winter months:

  • Dai Burchell chase runners if they’ve had a recent run (in the last 75 days)
  • Michael Scudamore chase runners running from October through to March, focusing on those that had a moderate last run (didn’t place)
  • Nigel Hawke’s chase runners in Class 1-4, and all last time out NH winners


- Jon Shenton

The Importance of Pace in ‘Speed’ Handicap Chases

After writing five articles on 5f turf handicaps it seemed sensible, as we were heading into Autumn, that I would start looking at pace in National Hunt racing, writes Dave Renham.

For readers who have not read my pace articles before I will precis what pace in a race means.  When I talk about pace my main focus is the initial pace in a race, and the position horses take early on. geegeez.co.uk has a pace tab for every race and the stats I am sharing with you in this article are based on the site’s pace section data.

The pace data on Geegeez is split into four – Led (4), Prominent (3), Mid Division (2) and Held Up (1). The number in brackets are the pace scores that are assigned to each section.

For this article I am concentrating on course data and creating pace figures for specific course and distance combinations – my focus for this piece is handicap chases of 2m 1½f or shorter. In some research 7 or 8 years ago, I noted a bias to front runners in these races – not as strong as some flat race front- running biases, but a bias nonetheless.

The first set of data I wish to share is the overall pace stats for handicap chases of 2m 1½f or shorter (minimum number of runners in a race 6):

Pace comment Runners Wins SR%
Led 1936 362 18.7
Prominent 4145 608 14.7
Mid Division 1423 144 10.1
Held Up 4459 388 8.7


We can see that horses which led or disputed the lead early have a notably higher strike rate in these handicap chases. Prominent racers have a good looking record too, while hold up horses tend to struggle.

Another way to illustrate the data is through Impact Values – the best explanation of an impact value or (IV) is one I read many years ago in a book by Dr William Quirin, called Winning at the Races. He stated that impact values “are calculated by dividing the percentage of winners with a given characteristic by the percentage of starters with that characteristic. An IV of 1.00 means that horses with a specific characteristic have won no more and no less than their fair share of races”.

To help explain IVs further let us use the ‘led’ stats in this article to illustrate the idea. As can be seen in the table above horses that have led early have won 18.7% of these races.

Summing all of the pace data, there were 1502 winners with a pace score* from a total of 11963 runners with a pace score which gives an overall win percentage of 12.56%.

If we divide 18.7 by 12.56, then, we get the impact value for leaders – this gives us an impact value of 1.49.

*Pace scores are derived from in-running comments. In about 5% of cases it is impossible to discern the early position of a horse from its in-running comment

Here are the impact values for each pace category:

Pace comment Impact Value
Led 1.49
Prominent 1.17
Mid Division 0.81
Held Up 0.69


Using either win percentages or the slightly more sophisticated Impact Values give us the same overall picture: in handicap chases of 2m 1½f or shorter there is a clear advantage to a more prominent running style – the closer to the lead early, the better.

As when I looked at 5f flat handicap pace data, there are significant differences in the course figures for these contests too with some courses being more suited to early leaders/front runners than others. Here are the courses with the best strike rates (25 front runners minimum):


Course Front Runners Wins SR%
Hexham 68 24 35.3
Taunton 39 13 33.3
Huntingdon 42 13 31.0
Lingfield 32 9 28.1
Wincanton 40 10 25.0
Plumpton 45 11 24.4
Sandown 46 11 23.9
Ludlow 82 19 23.2


For the record, Haydock’s strike rate for front runners was 38.9%, but there were only a handful of races (14). Now let us look at the courses with the best impact values which should give a more accurate measure of front running bias:


Course IV for Front runners
Hexham 2.96
Taunton 2.42
Huntingdon 2.31
Cheltenham 2.29
Lingfield 2.05
Hereford 1.93
Ludlow 1.81
Wincanton 1.80
Carlisle 1.80
Catterick 1.70
Sandown 1.68


The order is similar, but Cheltenham appears in 4th place in this list compared with a lowly 23rd placing on the SR% list. The simple reason for this is that chases of this type at Cheltenham have many more runners on average compared to all other racecourses. This perfectly demonstrates why Impact Values are so important and statistically meaningful.

Hexham’s front running bias is very strong – indeed it should be noted that hold up horses have a dreadful record there winning just 6 of the 56 races from a total of 174 runners (IV 0.29).

At the other end of the scale here are the courses with the poorest stats for early leaders/front runners in handicap chases of 2m 1½f or shorter:


Course Front Runners Wins SR%
Newcastle 44 6 13.6
Bangor 38 5 13.2
Ayr 55 7 12.7
Musselburgh 25 3 12.0
Southwell 94 11 11.7
Wetherby 50 5 10
Aintree 43 4 9.3
Newbury 40 3 7.5
Ascot 48 2 4.2


Very poor figures on the face of it for Ascot, Aintree and Newbury. Again, though, the impact values will provide a more complete picture. The table below shows courses that have a front runner IV of less than 1.00.


Course IV for Front runners
Newcastle 0.98
Musselburgh 0.96
Ayr 0.91
Southwell 0.91
Aintree 0.90
Wetherby 0.72
Newbury 0.58
Ascot 0.36


It provides further evidence that the Ascot figures for early leaders are indeed very poor, but interestingly hold up horses have not dominated at this course. The impact value for hold up horses at Ascot has been 0.91 – it is prominent runners (horses that track the pace) with an IV of 1.62 that have had most success in such races at Ascot.

This article to date has focused on front runners. Now I want to try and give a more rounded profile for each course. To do this I have created course pace averages as I did in my second article on 5f flat handicaps. I create course pace averages by adding up the Geegeez pace scores of all the winners at a particular course and dividing it by the total number of races. The higher the average score, the more biased the course and distance is to horses that lead or race close to the pace early. Here are the data:


Course Total Races Course Average
Hexham 56 3.18
Taunton 32 3.03
Ludlow 67 3.01
Sandown 32 2.97
Wincanton 30 2.97
Carlisle 36 2.92
Newton Abbot 69 2.86
Huntingdon 32 2.84
Lingfield 24 2.83
Haydock 14 2.79
Hereford 26 2.69
Plumpton 37 2.68
Southwell 64 2.64
Exeter 22 2.64
Leicester 40 2.63
Towcester 47 2.62
Kelso 72 2.60
Perth 32 2.59
Uttoxeter 54 2.59
Sedgefield 80 2.59
Worcester 99 2.59
Ffos Las 18 2.56
Chepstow 45 2.56
Catterick 35 2.54
Stratford 53 2.51
Doncaster 21 2.48
Newcastle 37 2.46
Bangor 30 2.43
Warwick 23 2.39
Cheltenham 35 2.37
Ascot 32 2.34
Wetherby 35 2.34
Market Rasen 12 2.33
Ayr 43 2.33
Aintree 31 2.32
Newbury 31 2.32
Musselburgh 20 2.30
Cartmel 36 2.17


It can be argued that these pace averages give a greater overall pace ‘feel’ to each course – it remains clear though that Hexham and Taunton are two courses where there is a very strong pace bias, early leaders there being more than three times as likely to prevail.

Being able to predict the front runner in handicaps chases of 2m 1½f or shorter at these two courses and, to a lesser degree, at Sandown, Wincanton and Carlisle – should provide a number of value betting opportunities this season. There are other courses that offer a strong edge too, of course, but these stand out particularly.

I hope this article has been of interest and as with most things in life, the more you ‘put in’, the more you tend to ‘get out’. I will personally continue to work hard researching pace angles because it has the potential to really pay dividends.

- Dave Renham

Tony Keenan: Watching the Markets…

A horse race can be over and done with in little more than a minute but the betting market for said race takes much longer to unfold, over 24 hours in most cases, writes Tony Keenan. It may be heresy to true fans of the sport, but most punters spend more time watching markets than races, with knowing when and how to execute bets an important skill. During this article I’m going to try to look at the evolution of a standard market on an average Irish race from start to finish, considering some of the factors that influence it and suggest what punters might bear in mind when timing their bets.


Overnight Prices

The starting point for most Irish betting markets now is the first batch of overnight prices between 4pm and 6pm the evening before the race; in most cases, Paddy Power Betfair are first up, followed by Bet365, Sky Bet, BetFred and Ladbrokes Coral in that broad order with the smaller firms coming in afterwards. A striking feature here is the timing; these prices are going up roughly six hours after declarations came through at 10.30am which is a really narrow window and certainly a massive difference to the age when prices went up the morning of the race.

Compilers working to produce odds in this timeframe are under pressure, some having to price up on a hundred horses for the following day, with simple math revealing that is little more than three minutes per horse. How many replays can you realistically watch in this time? Many will be skilled practitioners who watch tons of racing but the modern odds compiling environment means they are doing more with less and it is not unreas0nable to ask how deeply they get to study each horse or race; unlike punters who can pick their battles, they have to put a number to every horse that they will lay to at least some degree.

That degree is a major issue for many but let’s get real here: no one, unless you have access to a whale account, can get at these prices to any scale. And it is hard to see why it would be any other way; the limits in almost every sport are low when odds are initially posted and when punters talk about restrictions at this time, it could be that they are referring to limits which have be reduced across the industry for overnight prices. Even the very act of looking to bet the night before could be enough to get your account factored.

Not that I have any problem with someone looking to place a bet overnight: the reality in punting is that if you can get on, you will, and if you can’t, you have to sit and suffer. It would be punting utopia were everyone to wait until a set time the following day before striking a bet but this can be an inherently selfish game and there will always be someone looking to front-run your bet. A better question to ask might be how cheaply you are going to reveal your opinion, provided that opinion is of some value, and if you are playing overnight it is not unreasonable to think it might be, recreational punters rarely bothering at this stage of the market.

Taken as an entire group, the bets struck overnight are negative expected value for the firms; over time, they lose on overnights. The loss-leading aspect of this might be surprising for some but they are not in it for any real liabilities and the aim to get the prices right for the next morning when a great volume of bets and turnover comes in, particularly if said company has a retail estate. It is not unreasonable to think that every bet of size at this point, with size being relative, ticks the market one way or another.

A couple of points to finish up this section: overrounds are higher at this juncture so the question can be asked why laying bets overnight isn’t profitable? I suspect this is because they will only be laying the one, two or three horses that are wrong and the field book will be anything but balanced; the idea of a balanced book is more fantasy than reality in most cases but at this stage it can be particularly lop-sided.

There is also the issue of possible price manipulation which is something I’ll return to throughout this article. Most readers will know that bookmaking firms are heavily influenced by what happens on the exchanges but in most cases, the markets for the following day have next to no volume in them at this point. One could post up a bet that is under the available price that might cause a series of cuts but perhaps a better way to manipulate a price at this stage is to bet a horse in the race on a few marked accounts in the hope that your real selection may be pushed out so it can be backed at a more advantageous price. Plenty of firms will have an auto-cut approach to some accounts that are betting at this time.


The Next Morning

The theory for some of the firms with the overnights, as well as offering a service to their customers, is that any creases in their prices will be ironed out by morning. The point at which these prices become profitable to lay is open to question; it certainly won’t be very early on but the hope would be that by mid-morning they will have a set of prices that can be laid to some degree of confidence. It is worthwhile reminding ourselves of how little volume of the total betting turnover is actually done up to this point with the final figure of what is bet on the show never ceasing to amaze. In terms of singles only, the figures are likely to be about 5% overnight, 10% morning up to midday, 20% rest of the day through to fifteen minutes before the off, and as much as 65% on the show. This will vary depending on the make-up of each company but the importance of having things right for the time of the race is clear.

Overrounds will go down a little at this stage – if you take an Oddschecker screen grab of the typical race at 7pm the previous night and 9am the next morning there will be more pink [i.e. horses drifting] in the latter. The overall pricing is less defensive now with the obvious ricks generally being quickly ironed out, and this is also the time when some liquidity comes into the exchanges with Matchbook being a notably bigger player in this regard over the last few months; how long this will last, one never knows, but it does offer some volume now at the front end of the market at least.

It is also now that the prominent tipsters start to influence the market and for Irish racing that means Andy Holding on Oddschecker and Gary O’Brien on AtTheRaces. Both are excellent judges though I’m sure most punters can emphasise with that sinking feeling when they have put up something you fancied and you are forced to take shorter than you wanted. Holding tends to use times and sectionals a lot and I have noticed that his column has been going up a little later over the past few months, around 9.30am rather than around 9.00am. That may seem like a relatively meaningless difference but if you can get into a shop in that half an hour period you may be able to bet your selection before he puts it up though finding an office that opens before 10am in Ireland remains a challenge with Saturday the only exception. As an aside, I sometimes think that Saturday might be the best day to bet on Irish racing and not only because of the earlier shop opening. Saturday is the main racing day of the week in the UK and the Irish racing may not be getting quite the attention that it should from odds compilers and traders with prices lasting longer than they typically might.

The shops will all be open at this time and again many of the bets struck here will be negative expected value; bigger operations will be looking to get runners out and about and market moves now by definition are probably more meaningful as they can simply get more money on as the limits are raised and there are more avenues to place a bet. Plenty of the money staked on Irish racing is actually bet in UK shops and this is simply a numbers game with the UK having vastly more shops and related opportunity to get on.

Gary O’Brien can be all over the grid in terms of when his tips are posted on the AtTheRaces website but more often than not it is after shop opening. He is an example to all punters that you don’t need the early earlies to win as he proves very profitable despite many of the prices having been picked over. The prices about his selections invariably shorten but it tends to take more time than those from Andy Holding, likely because they are put up later in the day when the markets are slightly more robust. O’Brien’s selections tend to be form-based and he simply has an excellent knowledge of the Irish formbook, price conscious but not obsessed with the odds. Often he will put up an 8/1 shot that was 12/1 at one point but goes off 9/2 and we all should probably try to avoid the psychological anchoring that prevents us from taking the shorter price because we have missed top price as it can still be value.


Minimum Bet Liability

The latest wrinkle to be thrown in the morning trading is the minimum bet liability (MBL); at this point Paddy Power/Betfair, BetVictor and Sky Bet are guaranteeing online customers bets that can win up to £500 from various times across mid-morning and applied to different race grades. BetVictor’s conditions are about the best as it is across all races and includes an each-way option, and it may be reasonable to expect other firms to come on board with similar MBLs sooner rather than later: this is a copycat industry where approaches like cash-out and extra places have become available generally across different companies. An interesting facet of the BetVictor guarantee is that it applies to Irish racing as well as UK racing with Paddy Power Betfair doing similar on some but not all Irish meetings. This is somewhat surprising as Irish racing is traditionally viewed as toxic within the betting industry, something that is probably more perception than reality. Nevertheless, the perception is sufficiently widespread that it needs to be acknowledged.

The reasons for bookmakers adopting MBL are unclear. Certainly it has created a degree of good PR at a time when the whole sector has been getting a kicking from regulators though it may also be an admission that they were over-zealous in their restrictions, shutting down people they shouldn’t have. The Horseracing Bettors Forum deserves credit for their role too and, for all their efforts in other areas, it is likely that their achievements in addressing restrictions by which they will be judged. As to the sum of £500 or euro equivalent, one can only hope it’s a start rather than an end-point. A liability of £500 when having £200 on a 5/2 shot seems fine but it’s only a pony on a 20/1 rag and in reality punters have no issue walking into an Irish shop and getting that bet laid in the morning unless you are a Barney Curley lookalike. Punters do have the advantage of using MBL across a range of companies and a total liability that gets into the thousands is more respectable.

There are however some potential consequences to this. The whole idea of a guarantee is that it is open to all and that includes all sorts of arbers, robotic and human. I used to believe the arber argument was a bookmaker smokescreen to deflect from restricting winning customers, but I have spoken to enough people at this stage to realise that it is a real problem. Arbers bring nothing to the table but take out plenty; some will be content to trade out of a small profit on the exchanges while others have now twigged that holding the bets they make at prices over the exchange lay side [so called ‘line trackers’] offer positive expected value and will prove profitable over time. Betting companies are constantly closing robotic arbers though they face their share of human ones too, online and in shops, which are more difficult to regulate. It is reasonable to ask yourself where you stand morally on this; I think they don’t put in any work and, while it is easy to always see the bookmakers as villains, arbers are hardly innocents and allowing them free access to MBL makes little sense. As ever, differentiating them from genuine, opinion-based customers is the challenge.

Another potential game-changing aspect to MBL is how the bigger punting operations will use (and perhaps abuse) it. These groups are looking to take out large sums for their bets and perhaps MBL will mean they will hold their money until mid-morning and then try to smash a price. The logistics of how they would do this are not public knowledge but it is not unreasonable to suggest they could get access to 50 accounts with a bookmaker which, times £500, quickly becomes at £25,000 liability. Can the bookmaker refuse the guarantee if all the bets are co-ordinated to land at the same time? Again, the issue of possible price manipulation comes into play; would pre-MBL bets on marked accounts be used to push the price of the real fancy when mid-morning comes or could the exchanges be used to achieve a similar end?

How the bookmakers deal with this is a fascinating aspect. Perhaps some will be brave enough to ‘create an arb’ and lay their MBL prices when they are over the odds on the machine. They would need to have some confidence in their traders and compilers to do so and it would be much more likely on good racing than bad racing; Irish racing, sadly, probably falls more into the latter category. That’s a much more traditional model than we’ve seen in recent years and there are plenty in the industry who would simply tell you that if you’re over something on the exchanges, you’re just wrong. All of this leads to worries about what this will mean for the ordinary decent punter, price sensitive and likely winning a few quid but who has been restricted. They are the target market of MBL or at least should be but will they merely have access to a set of prices they don’t want?

When asked about some of these issues, Matt Scarrott, Director of Sportsbook at BetVictor, said ‘BetVictor acknowledged that the perception amongst some punters was that bookmakers are too quick to reduce stakes to a tiny amount or refuse all horse racing bets from certain customers. We entered into dialogue with Matt Bisogno of the HBF earlier this year, to see if any common ground could be found on that subject. We were keen to offer a guaranteed bet across all UK and Irish Racing regardless of the grade of the race and we were also keen to give closed customers the right to participate in this Guaranteed Bet market. At the time of writing several hundred previously closed accounts have been ‘reopened’ so that they can bet on this market. We are reviewing the market’s on-going performance as you would expect. Whilst in the vast majority of races we offer identical prices in the main book and the Guaranteed Bet book, we reserve the right to price certain selections differently, dependent mainly on the shape of the race. We also reserve the right to close (or re-close) customers for trading reasons, although currently we have not rejected any requests to reopen and have not reclosed any accounts.’


On The Show

As we have seen, the show is still when the bulk of betting turnover comes, though prices here can again be manipulated for relatively small sums. Exchange trading – unless said exchange is seeding their markets – will be relatively light for all but the better racing until 15 minutes before the off so it is not particularly hard for someone that way inclined to knock a horse from say 11/8 to 2/1 in the run-up to the show with the idea that the horse can then be bet back with the firms when prices come through and limits are their highest. That 0.625 of a point makes a massive difference if you are having a large bet and this does reveal a weakness in the approach that tracks the exchanges too much; yes they can be a useful guide but they can also be used to leave a false trail.

Despite the markets having been open for over 24 hours, there are still big swings in prices near the off, not least because this is the only time some major players can get on. It is generally accepted that the exchange prices at the off are efficient and over time a true reflection of actual win probability. I would tend to that view in the main but remember that the initial show is not as accurate and there are opportunities in this window for an edge. Furthermore, an important point is that they are generally efficient over time; they will not be correct in every case.

There are still cases when they are not accurate and as many different reasons why: maybe the connections of one horses just don’t punt to the same degree as another, perhaps a major punter who has travelled in for the race is planning a big bet but the ground changes making his horse vulnerable but can’t help himself and plays anyway. Beating the Betfair SP is well-known as a good way to judge your punting beyond simply overall profit and loss but it is not the only way and it can pay to be open to horses that the market just doesn’t fancy. They can and do win.

- Tony Keenan

The Ups and Downs of Tipping Services

Tipping Services. We all know of them. Many of us follow one or more, and many of you will follow Stat of the Day, geegeez.co.uk's own "anti-tipping" service which is currently enduring a difficult run. Let's call it a correction.

In this post, I want to talk about tipping services generally. Not about how to tell a good one from a bad one, or what measures you should put in place to protect yourself from unscrupulous charlatans. You can find that (useful) info elsewhere if you need it; or you can be assured that the services we trial and review here are almost always legit (after several hundred reviews there is the occasional bad apple in the barrel, sadly, but we do a lot of legwork to save you the time and effort).

No, I want to talk about the psychology of following a tipping service.

When we sign up to a tipster, we are essentially deciding to trust someone else's opinion. There should be good reasons for that, reasons way beyond the bold claims of an email or a sales page. Reasons even beyond solid proofed results over a notable period of time. We need to be clear about things like losing runs, how selections are arrived at, when they're delivered, whether quoted prices are attainable, and so on.

*

The Trouble with Hugh Taylor...

As an example, Hugh Taylor of Attheraces is a superb tipster, perhaps the best public picker in the game. But... he makes his picks on the morning of the racing, which for many people is a no go due to work or other commitments; and the prices, often only available in one place, evaporate in seconds; and even if you're able to get those prices, your betting accounts very quickly get marked and then restricted.

In other words, following Hugh Taylor simply isn't something which is feasible beyond a few short weeks. That's not his fault, but we need to be clear that those superb - and legitimate, to a degree - results are published for academic purposes only, as nobody can achieve them or anything much like them for very long.

Ditto to a lesser degree Pricewise, although the Racing Post no longer publishes an advised price because the nature of a price being printed in the newspaper the next day while markets continue to operate overnight is anachronistic.

So we need more than just good results to have success following a tipster.

*

The answer vs the working out

When we were back in school, maths exams would award marks for getting the correct answer. But there would generally be at least as many marks available for showing your "working out". That is, the rationale you followed and the means by which you arrived at the number you ultimately scribbled on the paper.

Tipping is the same. Some guys send the name of a horse and invite you to get on with it. No reasons, just a name. That's all well and good when they're winning - actually, it's not, but the malaise of this method is masked under such a scenario - but as soon as the losing run comes, what is there to fall back on?

Even if the deliverer of those names is really good, how can you know that?

It's my opinion that the best tipsters explain how they arrived at their selection. In that explanation may be more nutritional value than the pick itself, often much more.

For example, last week while sitting in for Chris on Stat of the Day, I flagged a horse called Secret Return at 8/1. He was sent off 3/1 favourite but finished nowhere. Now 8/1 is normally a good bit bigger than we post on Stat of the Day, but I wanted to share the name of someone I felt would be worthy of note in coming weeks. Here's what I wrote:

I wanted to highlight a new trainer who is definitely one to keep onside regardless of how today's (longer odds than usual) selection runs. His name is Paul George, and he's the son of Karen George. Since taking on the license he's hit the mark with some big priced winners, including 33/1 and 50/1, from just 18 starters so far.

Four of those 18 have won, and it would have been five but for Essgee Nics unseating - in a National Hunt Flat race - when leading inside the final furlong. Obviously with those big priced winners, George's figures are positive: he's +83.5 so far.

Like I say, Secret Return was well enough beaten on Saturday (though remains one to keep onside), but since then Paul George has run two horses, one of which won at 8/1 (the other was beaten at 28/1).

George has started really well and those who took the hint will have recouped their losing stakes from Saturday and then some. That's what I mean by the value in the working out.

It's the same every day with Stat of the Day where Chris crunches a plethora of data and produces noteworthy takeaways on an almost daily basis. Even when the picks are not winning - more on that in a minute - there are things to note for followers' own wagering. And, to be fair, it's the same with Hugh Taylor's tips. And with anyone else worth their salt.

*

Why follow a tipster?

So, why follow a tipster? As with most things in life, there are many paths that lead to such a decision. Some people are too busy to spend time in the form book, others don't trust themselves, and still others are simply not interested in the racing and see betting merely as a means to getting a few easy quids.

That last-named group are usually the first to cry foul, because they're not invested in the game and consequently derive no joy from the passage of a race: the result is all for them. No thrill, just bottom line. They take no accountability for their actions but, rather, want to outsource the getting of money whilst also abdicating the responsibility for the investment. Each to their own and all that, but there's little for such types here at geegeez.co.uk.

Most Gold subscribers who follow Stat of the Day also make their own selections from the data content we provide. One supplements the other, with the weighting varying from user to user. And, even in a losing run, those subscribers are informed along the way, the old grey matter inevitably absorbing snippets from day to day.

But, as I've hinted, following a tipster is not an abdication of responsibility. On the contrary. If you work for someone else, or someone else works for you, both of you are accountable for achieving - or not achieving - your goals.

The tipster follower's obligations include trialing a service before diving in (to check the volume of bets is acceptable, that the staking and time of delivery suits, that the odds range and associated losing runs are tolerable, etc etc); having a bankroll in line with expected downturns (and actually committing to using it); and making a strong determination to trust the service provider.

*

Negative reinforcement

That last point is important. Most people who follow tipsters have lost money in a similar scenario before. Many will have repeated this cycle a number of times. As such, there is an expectation of failure very soon after joining a tipster who has suffered a handful of losers. Those previously burned - whether it was their fault or not (and, sorry, but generally fault lies at least in part with the tipster follower) - decide to bail early in the process to avoid what they perceive as an inevitable crushing loss.

And then they move to the next service.

And guess what?

Rinse. Repeat.

This is just stupid, right? If that's you, please stop. Just step out of the tipster arena and try and pick your own winners. Or do something else entirely. Because your fear of failure is preventing you from any chance of success.

Again, if that's you, please don't be upset by the message. Think about it. Think about how you engage with tipsters and what you can do differently to give yourself a better chance, either in the tipster sphere or on your own.

Because here's the thing: most people join tipping services when the service is trumpeting a significant winner or winning run. Sadly, we've already missed that nirvana moment, and typically they are few and far between.

"After a good run, expect a bad run; after a bad run, expect a good run"

That adage was told to me aeons ago and I've always kept it in mind. Nobody and no endeavour is immune to variance, to "the slings and arrows of outrageous fortune".

*

Roger Variance

Variance is a statistical measure of how far data is spread out. There are more complex (and more accurate) definitions, but that will do for us here. In the case of racing results, it helps understand winning and losing runs and is relatable to average odds of winners and average win strike rate.

Let's take the classic coin toss example.

Heads has a 50% chance of winning, as does tails. But over the course of three spins, one or other could easily 'win' all three spins. However, over the course of 10,000 spins we'd expect something extremely close to a 50/50 split of heads/tails winners (assuming the coin is legit, etc). It is possible from that data, via standard deviation and other stuff I don't really understand, to calculate expected losing runs.

Using a set of verified results from a tipster service - or from one's own betting performance - we can perform a similar exercise.

The point here is more general, up a level. It is this: in any given sequence of bets there will be winning and losing runs which are out of line - often far out of line - with the overall average performance.

Five consecutive spins landing on heads is double what we'd expect, and thus tails has had no wins. But we wouldn't go changing the odds on tails coming in next, would we?

It's the same with long term proven tipping services. They will have winning runs, and they will have losing runs. Over a meaningful period of time, those will largely even out.

It might even be argued that the very best time to join a proven service is when it is in the teeth of a losing run.

*

What of Stat of the Day?

So Stat of the Day has had a rubbish August, part of a moderate summer overall. That's hard to swallow, especially for newcomers to it: they've not had the golden spring or winter which preceded the current downturn to sustain them.

Have a look at this chart.


In the context of just over 2000 bets spanning nearly seven years, we can see that the current downturn is only the third worst overall. The worst was between October 2015 and May 2016. But note how by the end of 2016 the losses were eradicated, and by May 2017 that downturn was a distant memory.

Likewise in late 2012 and into early 2013, there was a slide. By the end of 2013, that was reversed and a largely unabated winning run sustained itself until mid-2015.

The trend (dotted) line is really clear in this graph, meaning there is a very strong overall correlation between time (and, given the metronomic one-a-day nature of SotD, number of bets) and profit.

Assuming nothing has changed in the selection methodology - and NOTHING HAS CHANGED IN THE SELECTION METHODOLOGY - the reversion to the norm will come.

We have lots of very long-term subscribers who love Stat of the Day. The reasons are in its consistency - relatively, of course, see above - and in the general availability of prices, and in the explanation behind every pick, and in the accessibility of the service (published tea time the night before racing), and in the reliability of the tipsters and the plaform, geegeez.co.uk, on which they are published.

*

Summary

Tipping services are an up and down game. There are some good ones out there. I don't mean the over-exposed ones where you can't get on; but rather services like Racing Consultants and Cleeve Racing and, yes, Stat of the Day.

All of those services have losing runs. Losing runs do not invalidate the prior and future success of the services; they just twist your melon, man, as The Happy Mondays might conclude.

So, if you want to follow a tipster, do your due diligence (or allow us to do it for you) and know that it can be bad before it's good.

Good luck!

Matt

Predicting Mark Johnston Runners, Part 2

In the second part of this two part article, part one available here, Jon Shenton digs into Mark Johnston's performance record in search of profitable betting angles. Here he looks at older horses as well as Johnston's favourite course.

Older Horses

Roughly 70% of Johnston’s runners are 2- and 3-year-olds so perhaps there is less focus on his older horses. The vast majority of these more mature runners’ activity, as you might expect, is in handicaps (all bar 150 or so runs, which have a losing ROI of c.25% at SP). It makes sense, then, to concentrate on the journeyman handicapping cohort for further review.

Mark Johnston older horses (aged 4-9) in handicaps by race age restriction, from January 2013

Age restriction Runs Wins Win% P/L (SP) Place% ROI (SP) P/L (BF) ROI (BF) A/E
3yo+ 530 69 13.0 82.1 33.0 15.5 277.6 52.4 1.02
4yo+ 919 130 14.2 -218.4 32.5 -23.8 -136.4 -14.8 0.85


The table above shows the split of the runners in the two age groupings for eligible handicaps, and it is apparent that a Johnston 'older horse' in a 3yo+ handicap is worth a second look. In fact, if we split things down further by age of runner, we can see that the focus ought to be on 4- or 5-year-olds in 3yo+ handicaps. The table below illustrates the breakdown by age:


Mark Johnston trained older horses in 3yo+ handicap by age of horse from January 2013

Horse Age Runs Wins Win% P/L (SP) Place% ROI (SP) P/L (BF) ROI (BF) A/E
4 382 56 14.7 135.2 32.2 35.4 319.1 83.5 1.12
5 82 12 14.6 8.9 32.9 10.9 20.2 24.6 1.11
6 31 0 0.0 -31.0 41.9 -100.0 -31.0 -100.0 0.00
7 17 0 0.0 -17.0 41.2 -100.0 -17.0 -100.0 0.00
8 17 1 5.9 -13.0 23.5 -76.5 -12.7 -74.5 0.69
9 1 0 0.0 -1.0 100.0 -100.0 -1.0 -100.0 0.00


Horses aged six and older have a record of 1 win from 66 races, losing 95p in the pound over time.  In fact, checking the record of Johnston 6-year-olds-plus in all handicap races (including the 4yo+ category) makes for ugly reading with just 13 wins from 155 runs, something of a red flag when seeing horses such as Final or Watersmeet taking their place in the stalls next time.

The 4/5-year-old performance also comes with a major health warning sadly, in that there are a couple of long odds winners buried in there - at 66/1 and a couple of 33/1 shots too - which are enough to inflate the profit level significantly without negating the angle entirely. Ordinarily these could and probably should be ignored: it is not generally good policy to rely on a few Hail Mary’s to land so I’d probably take these out of the equation.  That may be a risk averse mindset but I have a preference for higher strike rates, and more reliable data-driven wagering.

That extra reliability can be attained by trying to establish which may be the better quality horses within the data. In very general terms the higher the weight carried (or ranking of horses' official rating in the race) the greater the chance of that horse winning in a handicap.

If we analyse these 4/5-year-olds in terms of position in weights (excluding jockey claim) we get the following breakdown:

Mark Johnston 4/5-year-olds in 3yo+ handicaps by position in weights (excluding jockey claim), from January 2013

Pos in weights Runs Wins Win% P/L (SP) Place% ROI (SP) P/L (BF) ROI (BF) A/E
1 104 22 21.2 40.7 47.1 39.1 54.4 52.3 1.24
2 64 14 21.9 16.5 31.3 25.8 23.8 37.2 1.48
3 75 12 16.0 16.3 34.7 21.7 29.8 39.8 1.06
4 43 4 9.3 -14.5 25.6 -33.7 -10.7 -24.8 0.72
5 39 5 12.8 -11.8 25.6 -30.2 -6.2 -15.9 1.01
6 31 1 3.2 -18.0 25.8 -58.1 -14.7 -47.4 0.30
7 20 1 5.0 -10.0 10.0 -50.0 -7.6 -37.9 0.49
8 22 3 13.64 6 31.82 27.27 11.43 51.95 1.51


As can be seen, horses in the top three in the weights are worth closer scrutiny, and I suspect that Johnston, with his vast army of young horses, knows better than most how to place his slightly older fleet to maximise probability of a strong run.


Courses: Goodwood

Mark Johnston’s positive training record at Goodwood is well documented: 53 victories over the past six years from 355 runs, with a pretty healthy 14% profit if you backed every single one at SP.

There are some cautionary tones to heed, however: during 2018 we’ve seen the best strike rate (18%) but the worst wagering return since 2013, with losses of 19% at starting price. Few braindead simple approaches last very long, and perhaps the market has wised up and adjusted, or perhaps it is genuinely a case of the shorter priced horses landing (average price of winners in 2018 is approx. 5/2 compared to the overall 13/2 or thereabouts).  One to keep an eye on as usually Johnston's second- and third-string entries can be relied on to hit their mark during the season, and especially at the Glorious - sorry, Qatar Goodwood Festival - meeting.

Overall, there are not many Johnston horses that go to Goodwood at huge prices. Indeed, only 23 have gone off with an SP of 20/1 or bigger, and not a single one has even hit the frame. It seems sensible to be apprehensive of any horse at these prices, with the yard apparently knowing more about what is expected than many in the betting media and indeed public.

Another consideration when evaluating trainers is checking how their runners perform in relation to their layoff: how many days they have been off the track. The table below shows the breakdown of all Johnston's Goodwood runners split by the last time the horses stretched its legs in competitive action.

Mark Johnston Goodwood runners (20/1 or shorter) since January 2013, by days since last run

Days Off Runs Wins Win% P/L (SP) Place% ROI (SP) P/L (BF) ROI (BF) A/E
2 4 0 0.0 -4.0 50.0 -100.0 -4.0 -100.0 0.00
3 1 1 100.0 2.5 100.0 250.0 3.1 305.9 3.45
4-5 11 1 9.1 -3.0 18.2 -27.3 -1.2 -11.1 0.74
6-10 59 11 18.6 0.0 52.5 0.0 4.0 6.8 1.27
11-15 67 12 17.9 23.4 41.8 34.9 33.3 49.7 1.34
16-20 52 14 26.9 68.8 48.1 132.4 84.0 161.5 1.89
21-25 38 5 13.2 8.0 36.8 21.1 15.7 41.4 0.90
26-30 21 0 0 -21 23.81 -100 -21 -100 0.00
31-45 31 1 3.23 -21 12.9 -67.74 -20.28 -65.42 0.24


It could be argued that the data alludes to the fact that Johnston has a plan in mind when sending horses to this particular corner of the Sussex countryside, getting them there in peak condition through a relatively recent tuning run, 11-25 days looking optimal. Backing in line with this improves the strike rate to nearly 20% and a SP profit level of 64%.  Horses that haven’t run for more than 25 days have a rather lean record of three wins from 69 runs (not all data included in the table) so should be considered unsympathetically based on that evidence; evidence which is supported by the fact that Johnston famously keeps his horses fit on the racecourse rather than at home, so greater absences may be assumed to infer an issue of some sort.


Summary

A fair amount of rummaging around the Johnston battalions since 2013 has kept me very busy, although it has still left a feeling that I’m just scratching the surface. Hopefully there are a few angles of interest, or at least some food for thought for development of your own approaches. As ever with analysis of this nature sample sizes can be small, but that’s the beauty and challenge of it all: trying to figure out if these snippets of data and patterns can be used as a basis to bet in the future, in this case to pinpoint some of Johnston’s next 4194 winners!


Possible angles and betting opportunities (from part one and two of this article)

  • Johnston First Time Out 2-year-old fillies over 5-6.5f, especially during the months of May to August
  • Previous 2yo winners in novice races if they have had a recent run throughout spring and summer
  • Winless 3yo runners with five or fewer career runs in 3yo handicaps
  • 4/5-year-old runners in 3yo+ handicap races, particularly if they are in the top 3 official ratings / weights
  • Goodwood runners shorter than 20/1 that have had a recent run (ideally 10-25 days)
  • Tread carefully with Johnston runners in nursery handicaps and any older horse (6+) running in a handicap.


- Jon Shenton


POST SCRIPT 3rd September 2018: My mate Ben Aitken has taken the Mark Johnston theme and run with it a little further, looking at performance by run style. Regular followers of Geegeez Gold pace content may be able to guess at the findings, but they're pretty striking all the same, and can be checked out here.

Predicting Mark Johnston Runners, Part 1

When Poet’s Society delivered win number 4,194 for Mark Johnston in the Clipper Logistics Handicap to cement his position as winning most trainer in UK racing history, I read a number of tweets about the impossibility and frustration in predicting how his sizeable battalion of horses perform, writes Jon Shenton.

This rang true: having searched high and low in the past for potential Johnston angles I’ve found it hard to see the wood for the trees. Perhaps the sheer volume of runners essentially evens everything out?   Surely though there must be something in that vast amount of data worth discovering? Armed with a renewed vigour I put the kettle on, fired up a database (the excellent horseracebase) and got to work.

The first question to ask, and answer, is, “where do you start?”. To me there is a certain logic in evaluating the yard by age groups, so in flat racing terms it makes sense to run the rule over Johnston’s ample contingent of 2-year-old runners in the first instance.


Two-year-olds

The volume of horses travelling through this yard from a young age is phenomenal. By my calculations there are on average around a hundred new 2YO debutants from the stable per year.  Backing them systematically is a complete no go as that would result in a loss of 17% at SP, however if we look at distance as a differentiator, we start to get a different feel:

Mark Johnston debutant 2yo's split by race distance (1st January 2013 to 24th August 2018)

Distance Runs Wins Win% P/L (SP) Place% ROI (SP) % P/L (BF) ROI (BF) % A/E
5f & 5.5f 145 30 20.7 -6.9 40.0 -4.8 10.0 6.9 0.94
6f & 6.5f 163 28 17.2 4.2 36.2 2.6 40.9 25.1 1.04
7f & 7.5f 156 20 12.8 -35.9 27.6 -23.0 -18.4 -11.8 0.81
1m & 1m.5f 67 5 7.5 -44.8 35.8 -66.8 -43.2 -64.5 0.68
1m1f & 1m1.5f 4 0 0.0 -4.0 0.0 -100.0 -4.0 -100.0 0.00
1m2f & 1m2.5f 3 1 33.3 -1.2 66.7 -39.0 -1.1 -36.3 1.49


Immediately we can see that the 5-6.5f debutants more or less break even to SP with a reasonable return to Betfair SP.  In my experience this is usually a good starting point for further investigation and with BOG on the table there would be many worse ways to wager than backing these all blindly.  However, I very much doubt you’re reading this to more or less break even, so let’s see if there is a better indicator in the data to improve punting performance.

A key component to consider with trainers often is the gender of the horse, in fact Geegeez’s own Tony Keenan appraised Irish Trainers and their relative performance with fillies, here.

Assessing Johnston’s debutants by gender is very interesting, as the table below indicates:


Mark Johnston’s debutant 5f-6.5f runners by gender (1st January 2013 to 24th August 2018)

Gender Runs Wins Win% P/L(SP) Place% ROI(SP) P/L(BF) ROI(BF) A/E
Colt 169 23 13.6 -74.0 33.1 -43.8 -62.6 -37.0 0.7
Gelding 2 1 50.0 6.5 50.0 325.0 11.2 559.0 2.7
Filly 137 34 24.8 64.8 43.8 47.3 102.3 74.7 1.3


In anyone’s book that’s quite a variance between colts and fillies (despite the 325% ROI I think with a sample size of two, we can ignore the geldings).  A debut MJ filly wins a quarter of the total runs and returns nearly 50% on SP, and that’s very much backing blind territory if you are that way inclined. Certainly such types are worthy of marking up when you’re betting in a race containing a Johnston debut juvenile filly.

Digging deeper, backing those fillies from May to August improves the picture, the runners early in the season generally underperforming, as do many fillies at that time of year.


Mark Johnston 2yo first time out fillies running May-August between 5f-6.5f in distance

Year Runs Wins Win% P/L(SP) Place% ROI(SP) P/L(BF) ROI(BF) A/E
ALL 98 26 26.5 79.3 45.9 81.0 115.5 117.8 1.5
2018 18 6 33.3 5.8 66.7 32.2 7.3 40.6 1.3
2017 20 5 25.0 39.0 35.0 195.0 60.0 299.8 1.7
2016 24 4 16.7 5.8 33.3 24.3 10.3 42.7 1.1
2015 17 6 35.3 18.5 52.9 108.5 22.3 130.9 2.1
2014 10 4 40.0 16.5 70.0 165.0 22.0 219.6 2.4
2013 9 1 11.1 -6.3 22.2 -69.4 -6.3 -69.8 0.7


The same underperformance applies to horses making their first strides in the autumn, which may be being geared up for 3YO handicaps the following season and potentially running to get a mark (more on those unexposed types later).

So, by backing Johnston first time out fillies over 5-6.5f from May to August a return on investment of 81% would have been achieved; just for clarity this covers both Maiden and Novice races.

Looking beyond the first-time out angle, considering novice races only (Johnston’s record in nursery handicaps is par at best so ignored for the purpose of this article) there is more of potential interest.   

Since the expanded novice programme was introduced in 2016 to encourage more sightings of maiden race winners, it is worth a check to see if Johnston is making use of these races by evaluating the performance of his previous winning horses.  The table below shows those runners in novices that have got their noses in front in their fledgling two-year-old careers.


Mark Johnston novice runners from 2016 to date with a previous career win

Runs Wins Win% P/L(SP) Place% ROI(SP) P/L(BF) ROI(BF) A/E
92 36 39.13 18.4 66.3 20.0 26.9 29.2 1.13


Three-year-olds

Considering the Classic generation, it was actually quite hard to find a robust angle but there is potentially something in evaluating unexposed horses in handicaps with very little in the way of solid form.  Taking all of Johnston’s 3yo runners in 3yo only handicaps we have the following:

Mark Johnston 3YO runners in 3YO only handicaps from 2013 to date

Runs Wins Win% P/L(SP) Place% ROI(SP) P/L(BF) ROI(BF) A/E
1736 262 15.09 -316.7 32.4 -18.2 -154.5 -8.9 0.9


That overarching dataset is miles away from a profitable or even remotely interesting angle; however, if we look for potential lurkers, horses that the market may overlook due to previous underwhelming performance there might just be a sliver of light to work with.

Mark Johnston 3YO runners in 3YO handicaps by number of career wins from 2013 to date

Career wins Runs Wins Win% P/L(SP) Place% ROI(SP) P/L(BF) ROI(BF) A/E
0 405 70 17.3 11.4 35.8 2.8 46.8 11.6 1.05
1 619 91 14.7 -184.8 31.5 -29.9 -121.1 -19.6 0.84
2 384 69 18.0 -31.2 35.2 -8.1 8.1 2.1 1.03
3 224 25 11.2 -54.5 28.6 -24.3 -33.2 -14.8 0.79
4 82 5 6.1 -44.1 23.2 -53.8 -42.1 -51.4 0.51
5 20 1 5.0 -16.5 20.0 -82.5 -15.9 -79.7 0.44
6 2 1 50.0 3.0 50.0 150.0 3.1 154.3 2.13
7 1 0 0 -1 0 -100 -1 -100 0.00


The top line is interesting. Horses that have no previous career wins running in a 3YO handicap for Johnston are marginally profitable if you back them all, and they have a respectable 17% strike rate too.  There are several ways to potentially sharpen from this starting point.  However, to stay with the unexposed theme, evaluating the horses’ total number of career runs might be considered a logical way to delve in a bit deeper; fewer runs should mean less predictable?

Mark Johnston 3YO handicap runners from January 2013 with no career wins, by number of career runs

Career runs Runs Wins Win% P/L(SP) Place% ROI(SP) P/L(BF) ROI(BF) A/E
3 91 19 20.9 8.0 37.4 8.8 16.7 18.3 1.21
4 87 21 24.1 45.9 40.2 52.7 56.8 65.3 1.41
5 60 11 18.3 16.0 36.7 26.6 26.6 44.3 1.03
6 51 7 13.7 -15.5 27.5 -30.4 -12.5 -24.5 0.88
7 37 7 18.9 -0.1 37.8 -0.2 1.8 5.0 1.22
8 29 1 3.5 -27.4 34.5 -94.4 -27.6 -95.3 0.23

Maybe fewer runs = more predictable!  No career wins, fewer than 6 career runs, 30% profit thank you very much.   Even if ploughing in on them all isn’t for you it’s a smart move to put an unexposed Johnston 3YO on your shortlist or at the very least be wary of them if you have another fancy in the race. This chart shows win strike rate, and ROI (SP/BSP) by number of previous starts for Mark Johnston maiden three-year-olds.


Those with more than eight career runs have a 4/50 win record and represent an incredibly poor way of investing.

Possible angles and betting opportunities:

  • Johnston First Time Out 2-year-old fillies over 5-6.5f, especially during the months of May to August
  • Previous 2yo winners in novice races if they have had a recent run throughout spring and summer
  • Winless 3yo runners with five or fewer career runs in 3yo handicaps

In part two of this article, I look at older horses and a course where the 'Always Trying' bandwagon are particularly potent. You can read that here >

- Jon Shenton

The Importance of Pace in 5f Handicaps: Part 5

This is the fifth instalment in a series of articles looking at pace bias in 5f handicaps, writes Dave Renham. In previous articles (the first of which is at this link, subsequent ones linked to from there) I have looked at a variety of angles including examining courses, as some offer a stronger front running bias than others; I have looked at the Geegeez pace ratings and how top rated pace horses have performed in terms of win percentages and profit/losses; I have also looked at predicting pace.

The Actual Front Runner

In this article I am going to focus solely on the actual early leader (front runner) of each race to see whether there are any patterns or decent angles that can be gleaned from the data. I have looked at 200 races once again focusing on handicap races with 6 or more runners. I have not used races where it was unclear who led early (this happens roughly 3 times in every 100 races). At this juncture, it is important for me to note that I term the front runner or early leader to be the horse that takes the lead within the first furlong. If a horse has led for 50yds and then is overtaken I assume the front runner to be the horse that took the lead after 50yds, not the horse that led just for 50yds. For the record in most sprint handicaps the horse that takes the lead in the opening strides is still leading after 1 furlong.

My first idea was to look at the leaders and what their position had been in the Geegeez pace ratings. To recap, horses on the Geegeez pace-card have their last four runs highlighted with the most recent run to the left and each horse has an individual total for their last four runs. 16 is the maximum score and 4 the minimum (this is assuming they have had at least 4 career runs).

To begin with I decided to split the runners into “thirds” like I have done in the past for draw bias. Hence in a 12-runner race, pace rated 1 to 4 would lie in the top “third” of the pace ratings, those rated 5 to 8 in the middle “third”, and those rated 9 to 12 in the bottom “third”. It should also be noted that I also adjust the pace positions when there are non-runners – for example in a 10 runner race if the 3rd highest pace rated horse is a non-runner, then the horse rated 4th becomes 3rd, 5th rated becomes 4th rated, etc. Here then are the figures where the leaders/front runners came from in the pace ratings broken into ‘thirds’:

Top third of pace ratings Middle third of pace ratings Bottom third of pace ratings
69.5% 24% 6.5%


As you can see the early leader came from the top ‘third’ of the pace ratings roughly 7 races in 10; in addition horses from the bottom third of the pace ratings took the early lead just once in every 15 races on average. This is a positive result – perhaps the result we might expect, but it is good to see that the Geegeez pace ratings clearly help in terms of pinpointing the area where we are most likely to find the actual front runner. It is also interesting to note that in races of 12 or more runners the early leader came from the top third of the pace ratings just under 75% of the time; in races of 8 runners or less this figure dropped to 64%. This suggests, albeit with relatively limited data that using the pace ratings to try and find the front runner works best in bigger fields.

To add some more ‘meat to the bones’ I have split the pace ratings into halves rather than thirds and the table below shows the breakdown:

Top half of pace ratings Bottom half of pace ratings
85.5% 14.5%


Hence, when you are trying to predict the front runner in a 5f handicap, the Geegeez pace ratings look the best starting point. If you can essentially narrow the potential front running candidates down to 50% of the field or less, you are giving yourself a much better chance of predicting the early leader.

As I have mentioned in previous articles, front runners in sprints over this minimum trip do have a huge edge – in this sample 22.5% of all races were won by the early leader and 51.5% of front runners made the first three. Hence the more often we can successfully predict the front runner the better.

In terms of the 200 early leaders in this sample, I next looked at their last two races and combining these last two pace figures (maximum of 8). Here are the findings:

Pace total (last two runs) Number of races ‘led’
8 47
7 44
6 50
5 37
4 16
3 2
2 4


Thus, 70.5% of all leaders had scored 6, 7 or 8 points in total when combining their last two pace scores. This data has a similar pattern to the top ‘third’ data for the last four races, as one would expect.

Just imagine if you were able to predict the front runner in every race - you would make a huge profit. Indeed if you could achieve this correct prediction around 70% of the time I would estimate you would still make very healthy profit; remembering even if the horse you picked as the front runner does not actually lead, it can still win!

In my fourth pace article I noted that just under 40% of top pace rated horses did actually lead; I did not though look at horses that were 2nd or 3rd pace rated. This time I have, and in 146 of the 200 races (73%) the early leader had been in the top three of the Geegeez pace ratings.

As I hope you can see, the Geegeez pace ratings do give an excellent indication of pace set up in a race. Whether you use the top third method; the last two runs method, or the top 3 in the ratings method.


In Play Options

There are of course other punting options in terms of front running ideas. One such idea is to trade the front runner ‘in play’. The argument for this approach is logical – front runners lose around 3 and a half times more often than they win so why not trade? Horses that lead in 5f handicaps generally contract in price so why not try to make the most of this fact? Now you could trade to achieve a free bet – eg back the horse at 11.0 pre-race and lay in play at 6.0. If the horses loses you get your stake back; if it wins you have a winning bet at 5/1.

Another option for traders is ‘dobbing’ - dobbing is a term I came across a few years back – I am not sure where it originates from, but basically ‘DOB’ means ‘double or bust’. Essentially if our bet/trade is successful, we double our original stake, if it is not successful we ‘bust’ or lose our stake. It may be easier to explain by giving you an example:

Let us imagine you back a horse pre-race at 8.0 for £10; in order to create a potential DOB you try and lay at half the odds for double the stake – so a lay at 4.0 for £20. If the horse hits 4.0 or lower in running, your lay bet will be matched and regardless of the result you will win £10 (less commission). Here is the simple maths behind the two potential winning outcomes - if the horse goes onto win the race you get £70 returned from the ‘back’ part of the bet; you lose £60 on the ‘lay’ part of the bet giving you that £10 profit; if the horse does not go onto win, you lose your £10 stake from the ‘back’ bet, but gain £20 from the lay stake – again giving you a £10 profit. Naturally, if the lay part of the bet is not matched you will lose your £10.

There are other ‘in play’ trading methods/options/ideas when it comes to front runners, but I don’t want to get bogged down looking at too many of these. Suffice to say, front runners tend to contract in price; some see their price drop dramatically.

In relation to this, one thing I wanted to look at was at what point was the early front runner overtaken? The longer a leader leads over 5f, in general the shorter the price will become ‘in play’. Here are my findings:


At what point was the front runner overtaken? % of leaders
Not overtaken (led all the way) 22.5
Overtaken in final half furlong (within 110 yds of the finish) 14
Overtaken between the furlong pole and half a furlong from the finish 19
Overtaken 1.5f from the finish to the furlong pole 23
Overtaken between the 2 furlong pole and 1 and half a furlongs from the finish 13
Overtaken before the 2 furlong pole 8.5


This should make pleasing reading for would be ‘in play traders’ – over 55% of front runners are still leading at the furlong pole; nearly 80% are leading 1.5 furlongs from the finish. There will be many of you reading this who have seen your horse lead at the furlong pole only to get swallowed up or beaten close home; perhaps now you have a trading option/idea which could potentially take away some of that pain in the future!


Actual front runners by odds

Finally, I looked at the prices of the horses that led early. Here is a breakdown:

  • There were 61 leaders that started 5/1 or less;
  • There were 52 leaders that started between 11/2 and 9/1;
  • There were 51 leaders that started between 10/1 and 16/1;
  • There were 36 leaders that started 18/1 or bigger.

So a relatively even split. Again this is almost certainly good news for ‘in play’ traders as there is excellent scope for trading front runners that start big prices. Indeed of those bigger priced runners (18/1 or bigger) 17 of the 36 were still leading at the furlong pole (a handful of these went onto win).

I hope you have found this article interesting and given you further food for thought. Maybe there should be a Geegeez competition next flat season to see who can pick pre-race the highest percentage of front runners in 5f handicaps. In fact it doesn’t have to be restricted to 5f races – maybe 5 to 7f races. Anyway, one for Matt to think about perhaps!

- Dave Renham

Your first 30 days for just £1