Read all sorts of commentaries and tips across a range of racing disciplines on the most popular horse racing blog in Britain, from staff and guest writers.
In today's video post, I'm delighted to share with you TWO brand new features we've added to Geegeez Gold. Like everything else in your Gold subscription, both are designed to assist you in making your betting more fun and more profitable; and, also like everything else in Gold, we've tried to make them as configurable and user-friendly as possible.
So, what are these new features?
Bet Tracker
The Bet Tracker has been in development for a little while now and I'm really excited to share a 'beta' version within the live Gold service. Beta means there might be a few bugs we've missed and, with your help, we'll get those ironed out as soon as possible. Having said that, for a major new feature, I think - at least I really hope - it's in pretty good shape.
So what is Bet Tracker? It's an unobtrusive means of recording your daily betting activity and subsequently monitoring your performance. As the video below demonstrates, you'll be able to drill down into your overall racing betting to see where you're most effective and, just as importantly, where you're losing more than perhaps you ought to be. You can review your history by course, distance, field size, trainer, jockey, race code, handicap or not, race class and more besides.
Watch this shortish video to discover more about our brand new feature, Bet Tracker:
Bet tracker software is selling for £100 a year - that was the first result I saw in a google search - but you get it bundled with your Gold subscription. And this is just Phase 1. In future, we plan to add Betfair SP functionality as well as more analysis variables and output options. For now, though, I hope you like the Geegeez Gold Bet Tracker.
*
Two New Ratings
Establishing how good a horse is can be a most subjective matter. Collateral form and official ratings help, of course, as on Geegeez Gold do Peter May's SR figures. To those, I'm pleased to be able to share with you two further sets of ratings, provided by Racing Post. They are Racing Post Ratings and Topspeed ratings.
Both of these sets of numbers, as well as OR and SR, can be switched on or off to suit your personal preferences. The short video below reveals (and hides!) all.
For those of you who like ratings, I hope this is something you'll find valuable as part of your Gold subscription.
https://www.geegeez.co.uk/wp-content/uploads/2019/03/bettracker_830x320.png320830Matt Bisognohttps://www.geegeez.co.uk/wp-content/uploads/2022/10/geegeez_banner_new_170x78.pngMatt Bisogno2019-03-26 11:32:262019-03-26 18:32:08Geegeez Gold: Introducing Bet Tracker and New Ratings
With Cheltenham now a fading speck on the horizon our next scheduled stop is the cavalry charge of the Lincoln in only a few days time, writes Jon Shenton. The shackles of winter are off (hopefully), Spring has sprung, and the flat turf season is well and truly on the way.
It’s without doubt my favourite time of year, certainly in terms of the racing calendar. The promise of the long, warm summer nights and a plethora of punting challenges stokes the fires like no other.
Conventional wisdom is that bettors should tread very carefully in the opening few weeks of the season whilst form-lines are built. Whilst that might be true to an extent if you’re a pure race reader it is certainly of less relevance to the data driven approach that I primarily use.
Horses having long absences, an array of new talent on show and highly variable underfoot conditions all contribute to devilishly difficult puzzles. Data can be your friend and ally under these circumstances and it can give you an edge on the general population.
A sensible point to start would be evaluating trainer angles for April performance.
The below table shows the April numbers, sorted by A/E and only including the usual SP of 20/1 or shorter animals. All races since 2012 are analysed.
One can clearly delve into any of these further. It’s certainly of interest that the highly populated Fahey yard is profitable over a high volume of runners. The same applies to Gosden, O’Meara, Appleby (Charlie), Haggas and Beckett. If they’re delivering runners to the track in April, then these data give a degree of confidence that they are likely to be competitive.
In pole position, however, is the veteran trainer Mick Easterby. He will be 88 years-old at the end of this month! If at a similar age I’m lucky enough to be around, I’d be hugely disappointed to be still working (understatement!) so it surely shows the enthusiasm he has for the game. Those rich experiences over the years certainly seem to have been put to good use in getting the yard's runners blasting out of the stalls early.
The April output is impressive with an A/E of 1.61, a nice strike rate (19%) and an ROI of 41% is more than welcome.
Evaluating performance against SP there is no winner at 18/1 or 20/1 from 26 attempts so from an angle point of view I’m going to exclude those personally. I do realise entirely that this may be folly, mathematically you’d only expect 1-ish winner from 26 attempts at those odds. But given the number of angles I operate and the relatively high number of daily bets I’m always happy to be more selective and potentially leave a winner or two on the bench.
Taking the 16/1 (SP) or shorter only it leaves 129 runs, of which 123 are in handicaps of some description. The remaining half-dozen non-handicappers have failed to register a single win. It’s clearly a yard focussed more on handicap racing so I’m happy to trim the angle accordingly again.
I also want to understand if April performance is uncharacteristically positive against the rest of the year. It could be that the basis of this angle applies to other months.
The graph below effectively puts the notion of strong other periods of the year to bed. It overwhelmingly illustrates the peak month for Easterby is April, with spikes in both win and placed rates in the month. It’s generally downhill from there as the season progresses.
Finally, to understand the consistency of the potential angle, a check of performance by year is helpful. Doing so we get the following split:
29 wins from 123 runs, 1.79 A/E with a 78% ROI. That’ll do for me. With no fallow year since 2014 this goes into my active angles as one to follow. Ordinarily these should go through a bit of testing before committing, but where’s the fun in that? I’ll be live with this in April, trying to get early prices. A high volume, small stakes approach mitigates the risk to some degree and enhances the entertainment value exponentially!
Back Mick Easterby in April handicaps at 16/1 or less on turf
*
Working down the list sequentially, the second-best performer in terms of A/E is John Quinn. The Yorkshire stable is a powerhouse of racing in the North. Around two thirds of his April runs are on relatively local Yorkshire tracks.
Starting with the April performance vs. rest of year this time we have the following by win strike rate:
On the chart I have marked the April data point with a red circle. Like Mick Easterby, it is clearly a landmark month for the stable.
A point of note, the March number is only representative of a handful of runners (15), and the same applies to November’s apparently phenomenal peak (17) so it’s easy ignore these months given the paucity of data.
Also, like the Easterby angle there is no winner at 18/1 to 20/1 so a small snip to the criteria to only take account of SP’s 16/1 or shorter is my personal choice. Looking at the annual performance there are two poor yyear, 2013 and 2014, which weirdly are also the same as Easterby. It might be that those were particularly cold or wet springs, leaving the horses a little short in their work, though that is no more than conjecture.
I’ve poked around looking for other trends or items of note with these data. In truth though, nothing stands out and there is usually little point in forcing it, such efforts usually leading to at least a degree of backfitting. Simple is best.
Back John Quinn runners at 16/1 or less on turf in April
*
Maiden & Novices
The onset of a new season means an absolute battalion of untried, untested and unraced 2YO’s will all hit the track for the first time. Like a lot of readers I don’t generally play in this type of race. Paddock judging is out personally, aside from worldly insight such as “that’s a big horse” and “that one looks a bit fired up” I have nothing to offer in this field, though I very much respect those who can read the confirmation, maturity and fitness of these babies. I have limited sources (i.e. none) of yard and course chat so the only thing in my armoury is my old mate, data.
From 2012 to date there have been no less than 14,911 horses making their racetrack debuts on turf as two-year olds in maiden or novice races. Changes to the novice programme in 2017 do make individual analyses on Maidens or Novice races more difficult on a like for like basis which is the reason that I’ve compiled them together.
This time I’m going to evaluate yards with a high number of runners, searching for the good and the not so good. The relatively massive table below shows first time out trainer performance in maiden and novices from 2012 onwards. I have elected to leave an SP filter out of the equation for this data set. The logic behind that is with debutants you could argue that the market is more likely to get it wrong and big priced winners could be more prevalent. This may or may not be true but that is the rationale for leaving the data as “pure” as possible.
As you might expect, there are some wild variations in performance. Firstly, the ones to potentially avoid, out at least around which to be wary.
Messrs Bell, Stoute and Easterby (Tim not Mick!) have a quite frankly appalling record under these conditions. In fact, the volume of combined winners is of such paucity that I can add it up confidently in my head without consulting any technology.
41 wins from 743 runners (I did have to check the runner number with a calculator). A strike rate of just 5.6%, with a combined loss of about 46% in terms of ROI. Good luck with that!
Of course, we know that SMS famously nurtures his charges along at a careful pace, so it makes complete sense for him to be here. The others are possibly more surprising. Geegeez Gold is of huge assistance in alerting you to these red flags on the trainer icon on the racecard, showing FTO performance of that trainer for the last two years.
Back to the macro-level data in the table relating to the last 6 years. The only trainers eking out a profit in the list are John Gosden and Andrew Balding. Gosden has the most impressive strike rate, 18.6%, on the table too. I must confess, I did find this a tad surprising so with a degree of curiosity I investigated it further.
Zooming in on monthly performance is logical in my mind. The early season calendar is rife with sprints. Short distance blasts are not something you’d ordinarily associate Johnny G with so might expect performance to be less positive early in the season in maidens/novices;
Sure enough, volume of runners, strike rate and ROI all improve as we move into and through through the hot summer (ha ha). Indeed, Too Darn Hot (August), Cracksman (October) and Coronet (September) all prevailed on their debut run in recent years.
In general terms you might think that Gosden’s strong hand of 2YO’s will be focussed towards the future, and specifically their 3YO campaigns. In fact, it’s quite common that he waits until his charges are three before giving them their first run: La Ti Dar is perhaps the best recent case in point.
To be honest, despite knowing all this there is not enough here to generate a sufficiently strong angle for me. I have evaluated race class, sex of horse and a number of other variables but there is nothing of huge significance. That said, I’d always be very mindful of a Gosden debutant once we get beyond the summer solstice and maybe play on that basis, but it’s certainly not for me in terms of a discreet “system” to run with.
Given the sheer heft of runners (633) and the worthy A/E attainment (0.99) it would be slightly remiss not to comment on the Fahey operation a bit further. In a similar way to Gosden it’s hard to find a robust angle to recommend although there are some clues and pointers worth drawing out.
Firstly, the earlier in the season the better as the graph illustrates, April and May are very strong in comparison to the rest of the year.
There is also interest when evaluating at the SP’s of all the stable's Maiden and Novice runs. The line graph below illustrates the cumulative profit or loss position by SP. In basic terms it shows that it is most profitable if Fahey’s first time out animals have been backed to 4/1 or shorter. Virtually every banding bigger than that is loss making.
Backing all 4/1 or shorter runners would result in a £26 profit to a £1 level stake (represented by the green arrow on the graph), whereas backing all 9/2 or greater would return a £97 loss (red arrow on the graph). We know two things about Fahey Maiden and Novice performance. Firstly, April and May performance is good. Secondly, horses at 4/1 or shorter are profitable. So, if we take April/May runners at 4/1 or shorter at SP I’d be optimistic we’ll find a reasonable angle. The table below gives us our answer:
There we have it. A small number of prospective bets, and at 4/1 or shorter it should be relatively low risk if unspectacular. It’s not really my sort of usual angle or bet (I tend to favour Hollywood odds long shots) but if you are inclined to have a bet in a maiden and novice race a short priced backed Fahey charge in the spring wouldn't be a bad place to start.
Back Richard Fahey First time out horses at 4/1 or shorter in Maiden/Novice races in April and May
*
I hope in the above I've offered a few potential pointers for success at the start of the British flat turf season. Do feel free to play around with Query Tool on some of the other names in the big tables, and leave a comment if you find anything of note.
- Jon Shenton
https://www.geegeez.co.uk/wp-content/uploads/2019/03/brocklesby_izzer.jpg316830Jonny11https://www.geegeez.co.uk/wp-content/uploads/2022/10/geegeez_banner_new_170x78.pngJonny112019-03-21 10:21:202019-03-21 10:21:20Early Season Turf Pointers
The stands have once again fallen silent after four breathless days of racing on Cleeve Hill, and the Cheltenham Festival 2019 is now confined to the memory banks and the history books. It was a captivating, challenging, emotional roller coaster of a week; these are my Festival reflections.
Champion Hurdler?
In the build up to the opening day, pundits and punters alike were relishing a duel between Apple's Jade and Buveur d'Air - or in some cases a three-way-go including Laurina - but what came to pass was one of those everyday 'you couldn't script it' scenarios for which racing's glorious uncertainty is known.
First, Apple's Jade was taken on at a helter-skelter lick by Melon, her chance seemingly compromised by this manoeuvre as she faded tamely into sixth. Meanwhile, reigning two-time champ, Buveur d'Air - with his trademark slick low jumping - took a liberty, and a consequential tumble, at the third flight. In so doing, he brought down Sharjah.
With the top two out of the race, as well as one of the key form line horses, surely it was Laurina's Champion Hurdle to lose? Lose it she did, the talk of her ascendancy proving some way wide of the mark. She was the only one of the supposed main three that had the chance to run her race, and she failed big time on this step up in grade. No obvious excuses there.
For Apple's Jade, it was a fourth visit to Cheltenham and a third defeat at a track where she seems to be beset by misfortune whether it's being in season, getting compromised on the lead or something else. It is not unreasonable to assume, given the full body of her work, that she is unsuited by the track.
And what of the winner and the placed horses? Espoir d'Allen, a progressive five-year-old bringing an eight-from-nine career record to the party, enhanced that to nine out of ten on this second attempt at Grade 1 company. He was soundly enough beaten in the Spring Juvenile Hurdle, his sole previous G1 effort, in February last year but may have been unsuited to the steady pace there.
This was fiercely run. Mark Walsh sat in midfield, away from the crazy tempo up top and, avoiding the fallers, came through almost in his own time to saunter fifteen lengths clear of a gallant but spent Melon, with 80/1 poke Silver Streak back in third.
Handicapping the race is difficult, especially for those intent on literal interpretations. Fortunately, some clever bods - notably Simon Rowlands in this piece on the ATR website - have confirmed what the peepers were suggesting: that they went way too fast early and slowed up dramatically late.
To contextualise that, Rowlands notes that the Champion Hurdle was run four seconds - about twenty lengths - faster to the third flight, and yet the differential at the line was a mere two-and-a-half lengths. Pace collapse territory. That enabled Mark Walsh and Espoir d'Allen to record even fractions throughout in a sort of tortoise and hare setup - if it's not beyond rude to refer to a Champion Hurdler as a tortoise!
The fact that Melon, spoiler-in-chief for the favourite, was able to cling valiantly to second in spite of running remarkably inefficiently anchors the form in my book. Five-year-olds have a notoriously weak record in the Champion Hurdle and, while that alone is far from sufficient to crab the victor, the nature of the run of the race with - as Rowlands again notes - the first six home in the Supreme bettering the Champion Hurdle runner-up's time leads me to downgrade the race in form terms.
Projecting to this time next year, Espoir can certainly win another Champion Hurdle: he'll be a year older and stronger, and he has that crucial track experience to boot. But he's a lousy price at 7/2 in a place (6/1 tops still not enticing). Buveur d'Air will be nine next year, an age that didn't stop Hurricane Fly or Rooster Booster this century, and won't stop him if his appetite is undiminished after this spill. Apple's Jade will surely not contest this again; ditto Laurina. Melon at 25/1 could be interesting each way though he's shown himself to be beatable, albeit in very different setups and where he's run above himself both times.
But the one which might be most appealing for long-range forecasters is City Island. The Ballymore winner has a much better record than the Supreme winner in the Champion Hurdle, and Martin Brassil's six-year-old was comfortably the best with all the right horses close enough behind to suggest there was no fluke to the performance. Enthusiasm for the 33/1 is tempered markedly by connections referencing the Stayers' Hurdle (for which he is 20/1) as his target in post-race debriefs; with that in mind, splitting stakes may be more sensible (if taking a price 359 days before an event is ever sensible).
*
National Hunt Chase 'Disgrace'
The National Hunt Chase is the second oldest race at the Festival, after the Grand Annual, but it has been run the most times due to the latter named being dropped for a chunk of the late 1800's - so wikipedia tells me, anyway. I also learn there that the race was considered the second most important, after the Grand National, in the calendar until the 1930's.
It is a four mile race for novice chasers ridden by amateur riders. For as long as I've been blogging and previewing Cheltenham - which is eleven years now, gulp - I've made mildly condescending noises about it. That's because I'm not a traditionalist, you see; I view most races through the prism of the sport as I see it and, naturally, as a wagering conduit.
This year, with welfare and good intentions aforethought, a number of jockeys in the race - notably Declan Lavery, who rode third placed Jerrysback - got into hot water with the stewards for persisting when their horses were considered by the arbiters to be too tired. These decisions have been roundly lambasted by horsemen of all vintages.
I am neither a traditionalist, as mentioned, nor a horseman, and additionally I have sympathy with the less militant parts of the welfare lobby, which leads me to an often conflicted head space on jump racing, a pursuit I love more deeply than flat racing. In that confused context, here's where I've got to: there WASa problem in the National Hunt Chase - there simply has to be when, despite changes to attract a better class of horse and despite amateur jockeys being closer to their professional counterparts in ability terms than at any other time in history, eighteen horses set out and only four finished.
Of the fourteen non-completions, eight fell, one of which sustained fatal injuries.
Quite frankly, that is bullshit.
I happened to watch the race with a fairly senior member of the BHA, and we both audibly winced when the wonderful mare Atlanta Ablaze came down two out. It was a bridge too far for a pair of hardened NH spectators.
Here's the thing: this race is hideously anachronistic. It is probably twenty years past its sell by date, hence the ongoing tinkering with its conditions.
I know that the trads will lobby for its retention and I understand the reasons why. But it cannot be countenanced for another year in its current format. Blaming the jockeys for trying their best in a race which makes extraordinary demands of both humans and equines, each group inexperienced in the context of the meeting as a whole, is big-time deflection.
The issue here is the race, or rather its conditions. Here is a suggestion, not intended as a 'we should do this' blueprint, but as a strawman starting point to be discussed, pulled apart, iterated and refined.
The National Hunt Chase should be run over three and a half miles. It would still be the longest main track race at the Festival but it would be one-eighth less attritional. It should be contested only by horses with a defined level of experience and also, potentially, with an approved level of jumping ability. It should have a ratings ceiling to prevent the dilution of the RSA Chase, and a floor to prevent horses being outclassed and put at risk. Horses should be six or older (almost all are), and carry eleven stone rather than 11-06 (and jockeys will have to be able to do the weight without wasting/fasting). Jockeys should have a defined level of ability/experience to ride.
All of the above would make the race less testing; none of the above would make the race less compelling. Let's sort this crap out and stop blaming jockeys for the errors of history and the programme book.
*
Joyful Thursday
If racing has a propensity to shoot itself in the foot, it also continues to produce human (and equine) interest stories of almost universal appeal. Last Thursday's racing looks set to be as enduring as it was endearing - it truly was one of the great days of racing.
Victory for the resurgent former Triumph Hurdler, Defi Du Seuil, was a terrific start. JP McManus is one of the more likeable of racing's mega-rich, for all that he is domiciled in Switzerland for tax efficiency purposes (he does distribute funds across a number of sports in Britain and Ireland which, I guess, is a more expedient direct contribution to racing), and his colours were worn to victory three times on this day.
Defi is a bit of a forgotten horse in a way. Considering he's won eleven of his sixteen races, and five of seven races at Cheltenham, he has been spoken of in somewhat disrespectful tones in the lead up to the JLT Chase. But he showed his usual class and some of his more occasional mettle to repel a regular rival, Lostintranslation, and confirm the Scilly Isles Novices' Chase form. This was the first winner of the Scilly Isles to double up in the JLT, breaking a sequence of second places.
That was but an amuse bouche for a couple of scintillating main courses. Before those, there was the Geraghty master class on Sire du Berlais, a horse that was sent off 4/1 favourite but traded as high as 240 in running. He looked cooked but BJG conjured a magic ride to get by one challenger and repel another in a tight finish.
Then came those delicious appetisers, starting with the Ryanair. This is a race which has been - rightly, in my view - called out in the past as a hiding place for second tier Champion Chase or Gold Cup prospects; but the 2019 renewal was a proper horse race, one packed with legitimate two-and-a-half-milers and legitimate Grade 1 horses.
From the veteran Un De Sceaux to Gold Cup non-staying fourth, Road To Respect, to Arkle victor, Footpad, to Cheltenham specialist, Frodon, all were worthy players for whom, with the possible exception of Footpad, this was undoubtedly the right race. Chuck in last year's winner Balko des Flos and another winner from Festival 2018, The Storyteller, as well as high class second season chaser, Monalee, and it was truly a deep and classy field.
Sometimes such setups disappoint, runners failing to show their true ability left and right. Not this time. It was a super race from start to finish, with a fairy tale outcome.
Frodon, incredibly, has only recently celebrated his seventh birthday and yet seems to have been around forever. Since joining Paul Nicholls he's made Cheltenham home, winning five of nine chase starts at the track. That palmarès was rounded off prior to Joyful Thursday by a huge performance off 164 (and top weight) in handicap company, and a battling victory in the Grade 2 Cotswold Chase over a trip beyond his comfort zone. Here he added a first Grade 1 success in typical front-running heart-on-sleeve style.
In the aftermath it was left to Frodon's rider, Bryony Frost, to speak for her horse. Her affection for their partnership, her joy at what they'd just achieved together, and her youth and exuberance are the sorts of PR racing can't buy. Her post-race anthropomorphism of Frodon to any microphone that was turned on was beautifully sincere, faintly bonkers and, frankly, absolutely bloody marvellous. That Bryony adorned many of the newspaper front pages as well as their other covers on Friday morning was a much-needed shot in the arm for a sport sometimes struggling for relevancy in a world that increasingly fails to 'get it'.
And, if that wasn't enough, Cheltenham Thursday - so often the poor relation of the four day meeting - was able to sustain the Festival feel-good factor through the day's other championship event, the Stayers' Hurdle. This time it was Andrew Gemmell, a racing nut who has been blind since birth, who was the centre of attention.
His Festival had already been noteworthy when Discorama, a horse he part owns, ran a brave second in the National Hunt Chase. But this lad, owned outright and a strong favourite for the long distance hurdle crown, was the one that carried his hopes and dreams. Trained by Emma Lavelle and ridden by Aidan Coleman, both seeking their first Festival Grade 1's, those who could watch the race were left in no doubt from some way out about who would win; at least not until a horlicks at the last which would have floored a more fatigued horse.
Gemmell, reliant on the on-course commentary, would also have heard a cacophony of gasps to attest to the late drama which unfolded at the final flight. But Paisley Park, and Coleman and Lavelle, and Andrew Gemmell were not to be denied this joyful moment on Joyful Thursday.
What a day of racing that was. Alas, racing is never all 'up'.
*
Triumph and Disaster
If you can meet with Triumph and Disaster
And treat those two impostors just the same
Kipling's these days almost trite verse about the journey to manhood will rarely have been more apposite than in the case of the boy-man Joseph O'Brien and the emerging brilliance of his four-year-old, Sir Erec. O'Brien is more than a chip off the old block, he is a carbon copy of the determination, diligence and intelligence of his father, Aidan.
Not 26 until May and rider of the winners of two Derby's, a 2000 Guineas and a St Leger, he already has a Classic victory and a Melbourne Cup win as a trainer. Although not named on the license at the time of Ivanovich Gorbatov's Triumph Hurdle win of 2016, he was widely rumoured to have been the trainer then; this was his chance to get a first Grade 1 win at the Festival.
But disaster tragically did strike. On the landing side of the fourth flight, Sir Erec broke a leg - I'm not sure how, I haven't been able to bring myself to watch the recording yet - leading to his inevitable euthanizing.
As I've already said, I'm an animal lover and a fan of the sport. In these days of heightened sensitivity in all walks of life - it sometimes feels like we're returning to a 17th century puritanical era - harmonising those two attributes, animal lover/NH fan, is increasingly difficult to explain to those who don't follow the game.
How can you love a sport where horses of the quality, beauty and, yes, purity of Sir Erec are allowed to be sacrificed? It's a deep and nuanced question, and it has different answers depending on who is asking. It's a huge issue, maybe for another day, but suffice it to say that I was reminded of Our Conor and that difficult day, and the nausea in the pit of the stomach remained through the rest of Friday afternoon.
But there is more to life. Indeed, JPOB probably couched it better than anyone when he was quoted as follows:
“We’re devastated about what happened to Sir Erec, but when you see what happened in New Zealand last night it puts it all into perspective…” – classy words from @JosephOBrien2 on the extremely sad loss of Sir Erec pic.twitter.com/5XYCrn57Al
Horse racing in the moment is everything, but when we pull our heads from the trough and see the stuff going on outside...
*
Gold Cup win no silver lining
We need to talk about Willie. Again. Some won't hear of such as what is to follow, but the evidence is growing and only faintly masked by the excellent performance of Al Boum Photo in winning the Gold Cup. At a time when, as mentioned already, racing is fighting a battle against a rising tide of animal welfare sympathisers, faller - and especially fatality - rates are something which are going to be closely scrutinised.
Any horse can fall of course, and misfortune is as accepted as it is unwelcome in the winter game. But some incur greater levels of misfortune than others. To paraphrase the peerless Oscar Wilde (without intention to belittle the subject),
To lose one horse may be regarded as a misfortune; to lose two looks like carelessness
The Mullins stable saddled two of the three horses fatally injured at last week's Festival.
Obviously that's a tiny number and could easily be noise. Indeed it is very likely noise in and of itself. But, when looking at larger datasets, we see a similar pattern. Here, for instance, are the fall/unseat rates at this year's Festival:
Total Fall/Unseat - 32/498 (6.4%)
WPM Fall/Unseat - 5/59 (8.5%)
That's still a tiny sample, so let's expand to 2009+ at the Festival, eleven years and all of the data in geegeez.co.uk's Query Tool:
Total Fall/Unseat - 368/5315 (6.9%)
Total Fall/Unseat excl WPM - 327/4852 (6.8%)
WPM Fall/Unseat - 41/463 (8.9%)
Regardless of how many more competitive runners the trainer has, this is a significant outlier at the top of an unwelcome chart. Comparing with his most immediate Cheltenham Festival peers - Messrs. Elliott (14/181, 7.7%), Henderson (19/401, 4.7%) and Nicholls (23/321, 7.2%) - fails to improve the picture by relativity.
And yet still some may contend that the samples are too small. So, as one final set of data, here are the fall/unseat figures (chase races only) for all starters in UK and Irish races since 1st January 2015 for a select group of top trainers:
The obvious next question is, "Why?".
It is not for me to answer that: I don't have any 'in' on the yard nor do I think value is added by speculating on the basis of nothing. However, I will reference this quote from the trainer regarding Cilaos Emery, a horse who missed the Festival, that might just offer a window on this world:
He pulled a muscle schooling in Navan the other day. That's why you didn't see him this morning. We'll have to wait and see how he's going to come out of it. If he doesn't come out of it in the next seven days, then I think we might have to draw stumps for Cheltenham. That's a disappointment, but when you school them you take your chance.
When you school them you take your chance...
*
Give Back Friday
On a wagering note, the week went well for me personally, and also for keen followers of the previews I penned on here. 40/1 advised William Henry was an obvious highlight from an odds perspective, though I was far more invested in shorter-priced runners, including my biggest bets of the week on Road To Respect - who blew his chance by bungling all of the last three fences - and Native River, who ran a creditable race which was only good enough for fourth. I'd had an overstaked each way bet on Anibale Fly at 33/1 which took some of the heat out of the Gold Cup situation but that, and small nibbles at big prices on Hazel Hill, could not quite cover the Friday losers elsewhere.
The County Hurdle (We Have A Dream 2nd at 25/1), Grand Annual (failed to have a small bet on the 66/1 winner, first time I've not backed him in four spins in this race) and Martin Pipe (over-staked bet on Dallas Des Pictons 2nd at 7/2) are races where you're not supposed to pick up. In fact the first and last of that trio were perfectly gettable - just not by me.
Adding into that a personal and perennial inability to identify the winners of either the Gold Cup or Triumph Hurdle, and the crap shoot that is the Albert Bartlett and oftentimes the Foxhunters as well, you'll see why I consider it 'Give Back Friday'; though of course that assumes that you've borrowed some off those lovely bookie types from Tuesday to Thursday.
*
How was it for you? Feel free to leave a comment below - I'd love to hear your thoughts.
Over the past week or two I’ve noticed as I’ve left work for the commute home that it’s getting lighter, writes Jon Shenton. The seemingly everlasting spell of only being at home in eternal darkness is coming to an end: spring is on the way!
It also means that the flat turf season is looming into view and I used the equine flu downtime to do a bit of much needed spring cleaning on my flat systems portfolio. More of that to come over the course of the next few months. Until then, let’s have a brief delve into a few thoughts and potential patterns regarding the spring-time National Hunt game.
Before I start in earnest, it does need noting that the relatively dry winter, coupled with equine flu, means that seasonal based angles may not be as relevant as trainer plans may have been shifted through necessity. Sadly, we’ll only know in a few months, but I still think there is strong merit in finding training operations which typically go through the gears over the next few weeks.
In the spirit of not changing the habit of a lifetime, I’ll kick things off with a massive data table, containing the trinity of A/E, Win(SR)% and ROI.
What are we looking at here then? Essentially, this is a table contrasting March-May trainer performance with all other times of the year in terms of A/E, SR and ROI. My usual 20/1 cut off applies (that is, I am ignoring all runners >20/1), and the trainers illustrated all have seemingly strong spring records, certainly in comparison to their performance across other times of the year.
The data are sorted by variance in A/E performance between the March-May period and the other months. I think by showing this contrast it helps highlight those yards truly peaking at this time of year.
Matt Sheppard
For example, Matt Sheppard sticks out like the proverbial sore thumb, with an A/E variance of 0.75, a SR variance of 14.5% and a ROI variance of 91%. At a high level, absolutely everything about these data point towards a promising angle, including the fact that it is another under the radar yard which always comes as a nice bonus.
Here is Sheppard's record from 2012 onwards, by year.
Not many negatives there!
However, there are always a few simple checks to apply, especially on a seasonal angle. A good starting point to achieve that is to check the performance by individual month, hopefully validating that our spring record is superior to other periods.
By splitting out by month we’ve found something potentially of interest. Firstly, the A/E in February is touching 1.8. This was not part of our original data set. The A/E in May is also less impressive (although still very reasonable) in relative terms at 0.97. The conclusion from this is that the radar needs a slight adjustment, potentially shifting to the left of the calendar a tad. Taking account of the February data makes sense, perhaps at the expense of jettisoning May. I’m not willing to expunge that month yet, as there may still be merit in drilling down into the data further.
First port of call for the zoom is to analyse Sheppard’s record by race type.
Striking difference? I think so. Look at that chase record in comparison to the other NH race codes. There’s a very strong 37% strike rate, A/E of 2.15 and a return on investment of very nearly 129%. At SP, too, with Betfair SP returns better by another 20 points!
Incidentally the May record for chasers is five wins from 26, A/E of 1.25 and ROI of 38%. Moderate in comparison to Feb, Mar and April, maybe, but still bankable.
The table below shows the February, March, April numbers only, leaving it as your call on whether to include the month of May.
Suggestion: Back Matt Sheppard Chase runners in Feb, Mar, April (and optionally May) at 20/1 or less
*
Chris Down
It is going to be very hard to follow that angle with something quite as compelling. Still, nothing ventured, nothing gained, eh? Let’s establish a better understanding of the data relating to Chris Down's Cullompton (Devon) yard.
Whilst checking a few contextual pieces of info I noticed something worthy of attention. The graph below shows the volume of runners from the yard by month. That clearly looks like a trainer that gears up for the months of April and May in particular, potentially keeping their powder dry over the January and February period where they have relatively few runners.
There clearly could be a multitude of reasons for this. One logical possible may be that in general horses trained by Mr Down prefer quicker ground than the typical NH animal, hence a focus on spring-time runners.
The table below shows all yard runs since 2012 (at 20/1 or less SP, irrespective of month). Interestingly, 56% of all runners were on ground officially described as good or quicker. This compares to 42% across the whole National Hunt population.
We can look at this in two ways. Firstly, this yard purely gears up for the spring. Secondly, and alternatively, this yard could simply be waiting patiently for good ground and the fact it is spring is merely incidental.
It is probably of limited relevance what the key reason is as the data are clear. However, it’s always of interest and importance to have an underlying logic when selecting or deselecting variables in your search for profitable punting angles. In this case there is a clear demarcation between Good/Good to Firm results and those on the more traditional ground conditions of National Hunt racing; but not enough for an angle.
So, back to the original spring data. The table below clearly illustrates a yard that focuses on competing over the smaller National Hunt obstacles in the main: this is in keeping, perhaps, with horses who prefer faster ground.
NH Flat and chase runners are low in volume and no firm conclusions could ever be drawn on such a small sample size. However, what we do know with certainty is that hurdle performance is strong. We don’t know for sure that NH Flat or chase form would follow suit if we had more data so for that reason I’m happy to exclude them.
There is another factor worth consideration, and it can be of interest with the smaller, arguably more regionally focused trainers such as the Down operation. The table below indicates the results of the yard by general area within the UK.
Evidently, this is a trainer who prefers to keep things close to his Devon base. Performance on the tracks determined as being in the South West is markedly more impressive than the rest of the country. Approximately two thirds of runners are saddled in this region, too, which of course makes sense from a transportation perspective.
For the record those courses are Cheltenham, Exeter, Newton Abbot, Taunton and Wincanton. Although data points are limited, the record in “central west England” (which is to say, Hereford and Ludlow) and Wales (Bangor, Chepstow, Ffos Las) appears to hold up too which makes sense given their proximity to the Devon base of the yard. Whichever way we think about it, runners from Chris Down's stable travelling away from its South West base perform poorly in comparison.
Suggestion: Back Chris Down Runners over hurdles at 20/1 or less where they are running in the South West, Wales or Central West England.
For completeness and perhaps your own manual adjustments here is a table of performance by specific track.
*
Mark Walford
Finally for today, we head to the dual-purpose yard of Mark Walford. Based in York there are approximately 30 horses in training currently across both flat and national hunt racing. At face value, performance on the level is a tick or two behind the performance over obstacles with roughly double the volume of winners in the National Hunt sphere from a broadly similar number of runs.
Adopting the monthly split approach illustrates peak performance in April through to June (arguably with an interesting period in the early throes of the NH season in Oct/Nov). This means another radar refinement: effectively ditching March and adding June to the equation.
The official going spread is again of interest:
That’s consistent enough and, angle wise, it doesn’t really change things. I’ve included the table as, like the Down yard, there’s a notably high proportion of runners on good ground, doubtless caused in part by the months in question. I did check if the yard's record on good or quicker held up all year round to see if that was an angle worth progressing but, in truth, it didn’t. In terms of volume of runners, winners, and A/E, the core months of April, May and June are where it’s at!
The data also show us (table below) that the Walford yard is one where horses appear to be better for a recent run. So, in terms of angle I’m going to tighten it by selecting only runners who have had an outing in the last two months / 60 days.
Suggestion: Back Mark Walford runners at 20/1 or less in April, May and June where the horse has run in the last 60 days
*
That's all for this edition. There are a few potentially interesting angles to be found when evaluating some of the other trainers on the main list for spring form published at the top of the article. At the very least I think all of these yards can have a small upgrade associated with any of their runners during this part of the season.
- Jon Shenton
https://www.geegeez.co.uk/wp-content/uploads/2019/02/MarkWalford_830x320.jpg320830Jonny11https://www.geegeez.co.uk/wp-content/uploads/2022/10/geegeez_banner_new_170x78.pngJonny112019-02-21 10:15:162019-02-21 10:16:08Jon Shenton: The Spring Trainers
In my most recent article, we looked at pace bias in 5f handicaps on the all weather, and as promised here is a follow-up looking at the 6f trip, writes Dave Renham.
For regular readers I appreciate the next few lines in some form or other seem to appear in all my pace articles, but for the benefit of new readers I need to clarify the following: when discussing pace the main focus is the initial pace in a race and the position horses take up early on. At www.geegeez.co.uk there is a pace tab within the racecards for each race, and the stats in this article are based on the site’s pace data. These pace data on Geegeez are split into four sections each of which are assigned points – Led (4), Prominent (3), Mid Division (2) and Held Up (1). For all my articles I concentrate on the numerical values to create a plethora of hopefully useful stats.
The minimum distance of five furlongs gives the strongest pace bias on the flat as previous articles have illustrated. However, there is still a bias to pace horses/front runners over an extra furlong, which I will demonstrate in what follows.
The first set of data I wish to share with you is the overall pace perspective for 6f all weather handicaps with six or more runners (the data for this article has been taken from the last 5 years 2014 to 2018):
Pace comment
Wins
Runners
SR%
IV
Led (4)
325
1812
17.9
1.75
Prominent (3)
523
4448
11.8
1.15
Mid Division (2)
155
2003
7.7
0.79
Held Up (1)
357
4886
7.3
0.72
These stats give front runners a solid edge – it is not as strong as over 5f but it is still significant. Just for comparison purposes let us look at the strike rates (SR%) and Impact Values (IVs) for 6f and for 5f:
Pace comment
6f
5f
6f
5f
SR%
SR%
IV
IV
Led (4)
17.9
22.3
1.75
2.04
Prominent (3)
11.8
12.5
1.15
1.15
Mid Division (2)
7.7
6.5
0.79
0.62
Held Up (1)
7.3
6.7
0.72
0.61
Over 6f front runners are still winning 1.75 times more often than average so we still have a decent starting point.
The main data for this article covers all-weather six-furlong handicaps with 6 or more runners. I then split the data into different field sizes – 6 to 8 runners; 9 – 10 runners; 11 or more runners. I did this ‘runner split’ for the 5f all-weather data in the previous article, and over that trip bigger fields produced the strongest front-running bias. As it turns out, this is replicated over 6f too:
6 to 8 runners
Pace comment
Wins
Runners
SR%
IV
Led (4)
536
104
19.4
1.41
Prominent (3)
1093
167
15.28
1.11
Mid Division (2)
304
27
8.88
0.66
Held Up (1)
988
107
10.83
0.79
9 to 10 runners
Pace comment
Wins
Runners
SR%
IV
Led (4)
548
100
18.25
1.73
Prominent (3)
1351
163
12.07
1.15
Mid Division (2)
549
43
7.83
0.74
Held Up (1)
1477
113
7.65
0.73
11 or more runners
Pace comment
Wins
Runners
SR%
IV
Led (4)
728
121
16.62
1.98
Prominent (3)
2004
193
9.63
1.14
Mid Division (2)
1150
85
7.39
0.88
Held Up (1)
2421
137
5.66
0.67
The IV for front runners increases as the number of runners increases. This is somewhat counter-intuitive and is therefore worth bearing in mind.
The article that discussed 5f all weather sprints looked at each course and distance individually. Once again this is the plan here, as different courses have different layouts, and also there are differences between certain track surfaces too. Let's start with Chelmsford and work through alphabetically.
Chelmsford
Pace comment
Wins
Runners
SR%
IV
Led (4)
58
278
20.9
1.97
Prominent (3)
71
562
12.6
1.19
Mid Division (2)
31
422
7.3
0.71
Held Up (1)
44
671
6.6
0.62
Just over a fifth of the 6f handicap races (SR 20.9%) at Chelmsford have seen the early leader going on to win. This compares with a strike rate of 26.3% over 5f: not quite as strong but with an IV close to 2 the front-running bias is still clear.
It has already been noted that in bigger fields at all of the all-weather courses the front-running bias seems to be more evident. This is certainly the case here: in races of 11 runners or more at Chelmsford, the front runner has prevailed an impressive 21 times from 87 giving a strike rate of 24.1% and an Impact Value of 2.93.
The draw seems to be material here, too, with those horses drawn nearest to the inside rail performing best when taking the early lead (all 6+ runner races). That makes sense as they will be taking advantage of the shortest route. Horses that have led early from one of the three lowest draws in these big field Chelmsford 6f handicaps have won 25% of their races with an Impact Value of 2.28.
Kempton
Pace comment
Wins
Runners
SR%
IV
Led (4)
72
388
18.6
1.85
Prominent (3)
107
938
11.4
1.14
Mid Division (2)
41
542
7.6
0.78
Held Up (1)
84
1123
7.5
0.75
The 6f trip at Kempton has a decent number of races each year giving punters plenty of opportunities to get involved. Front runners have a clear edge here and, as with Chelmsford, field size accentuates this.
In 6f handicaps of 11 or 12 runners (12 is the maximum at Kempton), front runners have secured 39 wins from 176 runners (SR 22.2%) with a very high Impact Value of 2.53. However, the draw data suggest there is no clear advantage to front runners drawn near to the inside rail (low).
Lingfield
Pace comment
Wins
Runners
SR%
IV
Led (4)
68
297
22.9
2.07
Prominent (3)
76
590
12.9
1.16
Mid Division (2)
32
380
8.4
0.79
Held Up (1)
50
745
6.7
0.61
The statistics for Lingfield seem to suggest front runners there have the biggest edge compared with the other five UK all-weather courses. Any front runner here that is well fancied has done extremely well: horses that were either favourite or second favourite and led early over 6f here went on to win 39 times out of 80 runners equating to a win rate of nearly 50%.
Newcastle
Pace comment
Wins
Runners
SR%
IV
Led (4)
23
143
16.1
1.74
Prominent (3)
34
394
8.6
0.94
Mid Division (2)
17
197
8.6
0.97
Held Up (1)
40
485
8.2
0.89
Coincidentally, the front running IV over 5f at Newcastle is also 1.74. Front runners do have an edge here but it is not a course I personally get heavily involved with, as the straight track for all distances up to a mile makes it a unique test of an all-weather horse in Britain. That greater emphasis on stamina produces the reverse to Kempton and Chelmsford, with front runners struggling in bigger fields.
Southwell
Pace comment
Wins
Runners
SR%
IV
Led (4)
33
166
19.9
1.85
Prominent (3)
102
690
14.8
1.38
Mid Division (2)
7
124
5.6
0.57
Held Up (1)
17
491
3.5
0.32
A reasonable IV of 1.85 for front runners, but it is also worth noting that horses which come from midfield or off the pace really struggle here just like they do over 5f. One other area worth sharing with you is when a front runner also happens to be in the top 5 of the Geegeez speed ratings, it has won on 22 of 79 occasions (SR 27.9%) producing an IV of 2.50.
Wolverhampton
Pace comment
Wins
Runners
SR%
IV
Led (4)
71
540
13.1
1.33
Prominent (3)
133
1274
10.4
1.06
Mid Division (2)
27
338
8.0
0.87
Held Up (1)
122
1371
8.9
0.9
Comfortably the poorest stats for front runners are at Wolverhampton, where there is a very small edge only and little to write home about. Indeed, pace seems to be far more balanced across the run styles at Wolves than at any of the other tracks.
*
Before I finish, in other articles I have used the various figures to create course and distance pace averages. I do this by adding up the pace scores of all the winners at each course and dividing it by the total number of races. The higher the average score, the more ‘biased’ the course and distance is to horses that lead early or race close to the pace.
Here are the 6 furlong handicap C&D pace averages for the six aw courses:
Taking all the data into account, six furlong handicaps on the all weather do offer ‘pace’ punters a potential edge. It is, unsurprisingly perhaps, not as strong as over five furlongs, but still strong enough to give clued in bettors a good leg up on the opposition. All we need now is to find a fail-safe method to predict the front runner...
- Dave Renham
https://www.geegeez.co.uk/wp-content/uploads/2017/12/sodslaw.jpg319830Dave Renhamhttps://www.geegeez.co.uk/wp-content/uploads/2022/10/geegeez_banner_new_170x78.pngDave Renham2019-02-20 10:21:432019-04-23 08:10:02Pace Wins The Race: 6f All Weather Handicaps
We still have several weeks of the all-weather season left so I have decided to look to see how strong the pace bias is on the sand, writes Dave Renham. I have not previously looked in detail at all weather pace bias in my Geegeez articles so now seemed as good a time as any.
Just in case you have not read my previous articles on pace I will briefly summarise a few things. Firstly when I discuss pace my main focus is the initial pace in a race and specifically the position horses take up early on. Most of you will be aware that on geegeez.co.uk racecards there is a pace section, and the stats in this article are based on the site’s pace data.
This info is split into four groups - Led, Prominent, Mid Division and Held Up, and after each race all the horses are assigned points in regards to which position they took up early in the race. Leaders get 4, prominent runners 3, horses that ran midfield 2, and those held up score 1. Just over 96% of all UK and Irish runs since 2009 have been scored, the other 4% unable to rated from the comment. For clarity, at the time of writing, 1,169,760 of 1,218,499 comments have been scored.
In previous articles, I have highlighted certain distances / race types that generally favour front runners both on the flat and over the jumps. My first five articles looked at 5f handicaps where pace bias is arguably at its strongest, but I did not look in detail at any course data for the six UK all weather tracks – my main focus was turf handicaps. Hence, a touch belatedly perhaps, it is time to address that now!
The first set of data I wish to share with you is the overall pace stats for 5f all weather handicaps with 6 or more runners (the data for this article has been taken from the last 5 complete years, 2014 to 2018):
Pace comment
Wins
Runners
SR%
IV
Led (4)
254
1137
22.3
2.04
Prominent (3)
360
2874
12.5
1.15
Mid Division (2)
67
1026
6.5
0.62
Held Up (1)
183
2735
6.7
0.61
These figures clearly illustrate the advantage to horses which have led, or disputed the lead, in 5f all-weather handicaps. In fact, the Impact Values - a measure of how much more likely than normal something is to happen, 1 being 'normal' - suggest that 5f handicap pace bias is slightly stronger on the all weather than it is on the turf.
The main data cover all handicaps with six or more runners; I have next looked at splitting these data into groups – 6 to 8 runners; 9 – 10 runners; 11 or more runners. Here are my findings:
6 to 8 runners
Pace comment
Wins
Runners
SR%
IV
Led (4)
119
459
25.9
1.86
Prominent (3)
138
956
14.4
1.04
Mid Division (2)
22
249
8.8
0.64
Held Up (1)
65
757
8.6
0.62
9 to 10 runners
Pace comment
Wins
Runners
SR%
IV
Led (4)
85
446
19.1
1.81
Prominent (3)
146
1083
13.5
1.28
Mid Division (2)
30
435
6.9
0.66
Held Up (1)
68
1125
6.0
0.57
11 or more runners
Pace comment
Wins
Runners
SR%
IV
Led (4)
50
232
21.6
2.60
Prominent (3)
76
835
9.1
1.10
Mid Division (2)
15
342
4.4
0.53
Held Up (1)
50
853
5.9
0.71
It seems therefore the front running bias is as its strongest when there are more runners. An IV of 2.6 for front runners is extremely high for races of 11 or more runners.
Of course, each all weather course has its own unique confirmation and, consequently, its own set of stats. Here is a view on the courses individually, presented in alphabetical order:
Chelmsford
Pace comment
Wins
Runners
SR%
IV
Led (4)
51
194
26.3
2.26
Prominent (3)
40
346
11.6
1.00
Mid Division (2)
22
252
8.7
0.78
Held Up (1)
30
410
7.3
0.63
Just over a quarter of the 5f handicap races at Chelmsford have seen the early leader going on to win. This is a very high percentage and worth noting. It is also worth pointing out that in races of 11 or more runners 9 of the 27 races (SR 33.3%) have been won by the front runner (IV 3.84). Not only that, another ten have been placed. Hence just over 70% of all front runners in these bigger field races have finished in the first three.
Kempton
Pace comment
Wins
Runners
SR%
IV
Led (4)
23
84
27.4
2.36
Prominent (3)
24
170
14.1
1.22
Mid Division (2)
4
72
5.6
0.49
Held Up (1)
8
177
4.5
0.39
It is a shame that Kempton seem to have so few 5f handicaps these days as the front running bias is at its strongest here. There is a decent inside draw bias here also and it should come as no surprise that front runners from the lowest three stalls have secured 11 wins from 33 (SR 33.3%). The IV is 2.88 for those well drawn pace setters. Hold up horses have a dreadful record also which is worth mentioning too.
Lingfield
Pace comment
Wins
Runners
SR%
IV
Led (4)
54
208
26.0
2.13
Prominent (3)
57
377
15.1
1.24
Mid Division (2)
16
227
7.0
0.59
Held Up (1)
31
436
7.1
0.58
Lingfield is another of the all weather courses to demonstrate a strong front-running bias over 5 furlongs. Additional insights are hard to find, although early leaders who were drawn 1 (the lowest draw) have produced 14 wins from 36 (SR 38.9%).
Newcastle
Pace comment
Wins
Runners
SR%
IV
Led (4)
22
137
16.1
1.74
Prominent (3)
37
393
9.4
1.03
Mid Division (2)
11
183
6.0
0.67
Held Up (1)
40
473
8.5
0.92
Newcastle has the weakest front-running stats of the six all weather courses, almost certainly linked (like Southwell) to it being a straight five as opposed to running around a turn, but an Impact Value of 1.74 still indicates front-runners do have an edge. Hold up horses perform quite well here so it is not a course and distance I personally get too involved with.
Southwell
Pace comment
Wins
Runners
SR%
IV
Led (4)
27
142
19.0
1.81
Prominent (3)
94
730
12.9
1.23
Mid Division (2)
4
102
3.9
0.41
Held Up (1)
14
342
4.1
0.40
The second lowest IV (1.81) for front runners, and again the straight nature of the track is likely a factor at a course where pace setters do well at other distances. Note that horses which try to come from midfield or off the pace really struggle over the five at Southwell. I have found no major additional angles to profit from, but ultimately steer clear of horses that regularly are held up.
Wolverhampton
Pace comment
Wins
Runners
SR%
IV
Led (4)
77
372
20.7
1.90
Prominent (3)
108
858
12.6
1.16
Mid Division (2)
10
190
5.3
0.52
Held Up (1)
60
897
6.7
0.61
Decent front running stats for Wolverhampton, too. Front runners when drawn close to the inside rail, (draws 1 to 3), have scored 32 times from 132 races (SR 24.2%) with an IV of 2.14.
*
Before I finish, we can use these numerical figures to create course and distance pace averages. I have done this by adding up the pace scores of all the winners at each course and dividing it by the total number of races. The higher the average score, the more ‘biased’ the course and distance is to horses which lead early or race close to the pace. This hopefully gives us the final piece of the jigsaw. Here are the 5 furlong handicap pace averages for the six aw courses:
Hopefully this article has demonstrated how strong the front running bias is on the all weather over the minimum trip of 5f in handicap races. The four turning courses offer a huge edge in my opinion. My next article is going to look at 6f handicaps on the all weather so watch this space!
- Dave Renham
https://www.geegeez.co.uk/wp-content/uploads/2019/02/Lingfield5f_GraciousJohn_830x320.jpg320830Dave Renhamhttps://www.geegeez.co.uk/wp-content/uploads/2022/10/geegeez_banner_new_170x78.pngDave Renham2019-02-14 10:22:492019-04-23 08:10:18Pace Wins The Race: 5f All Weather Handicaps
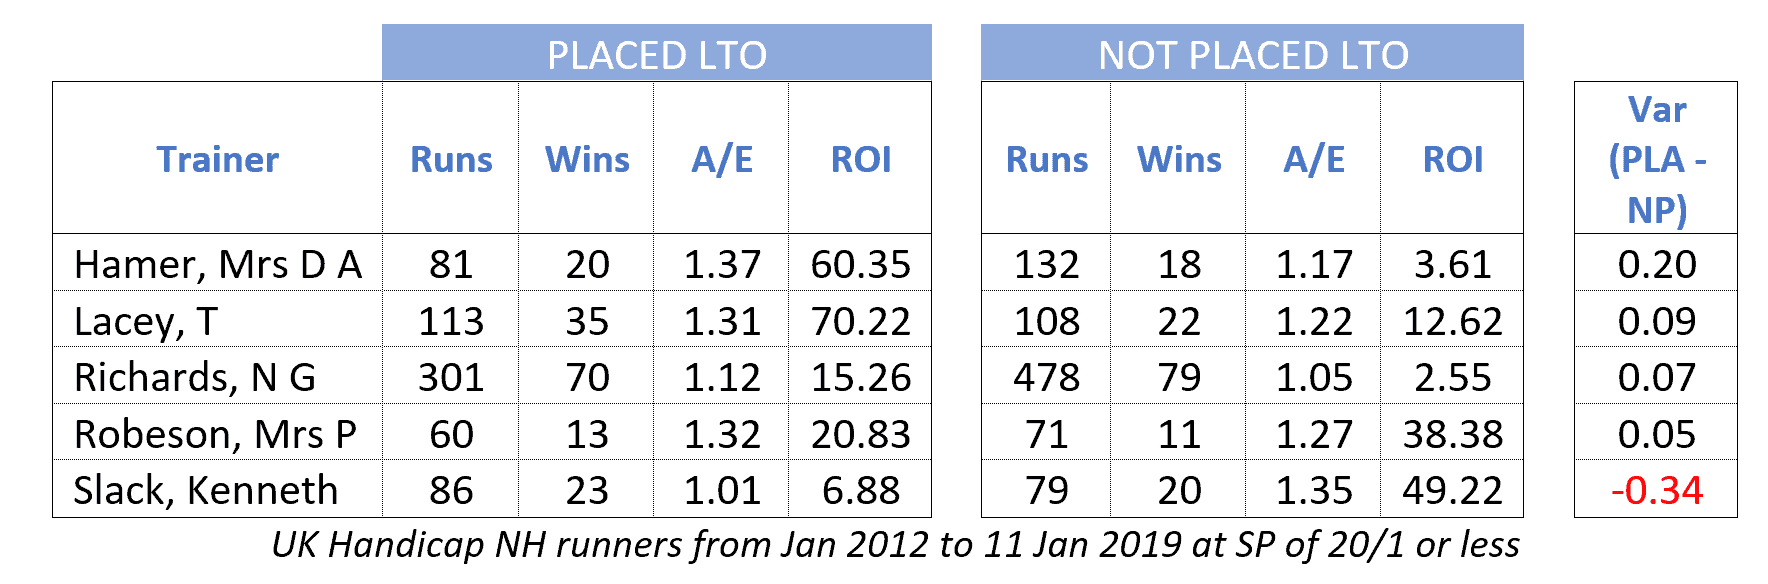
This is the second of a two part article. In the first piece, which can be found here, I highlighted a number of training operations worthy of a second glance if their horses ran well enough last time to finish in a placed position.
This follow-up will explore the other side of the equation: trying to find those trainers whose horses perform well after a moderate or disappointing run, specifically having finished unplaced last time out (LTO).
The Leftfielders
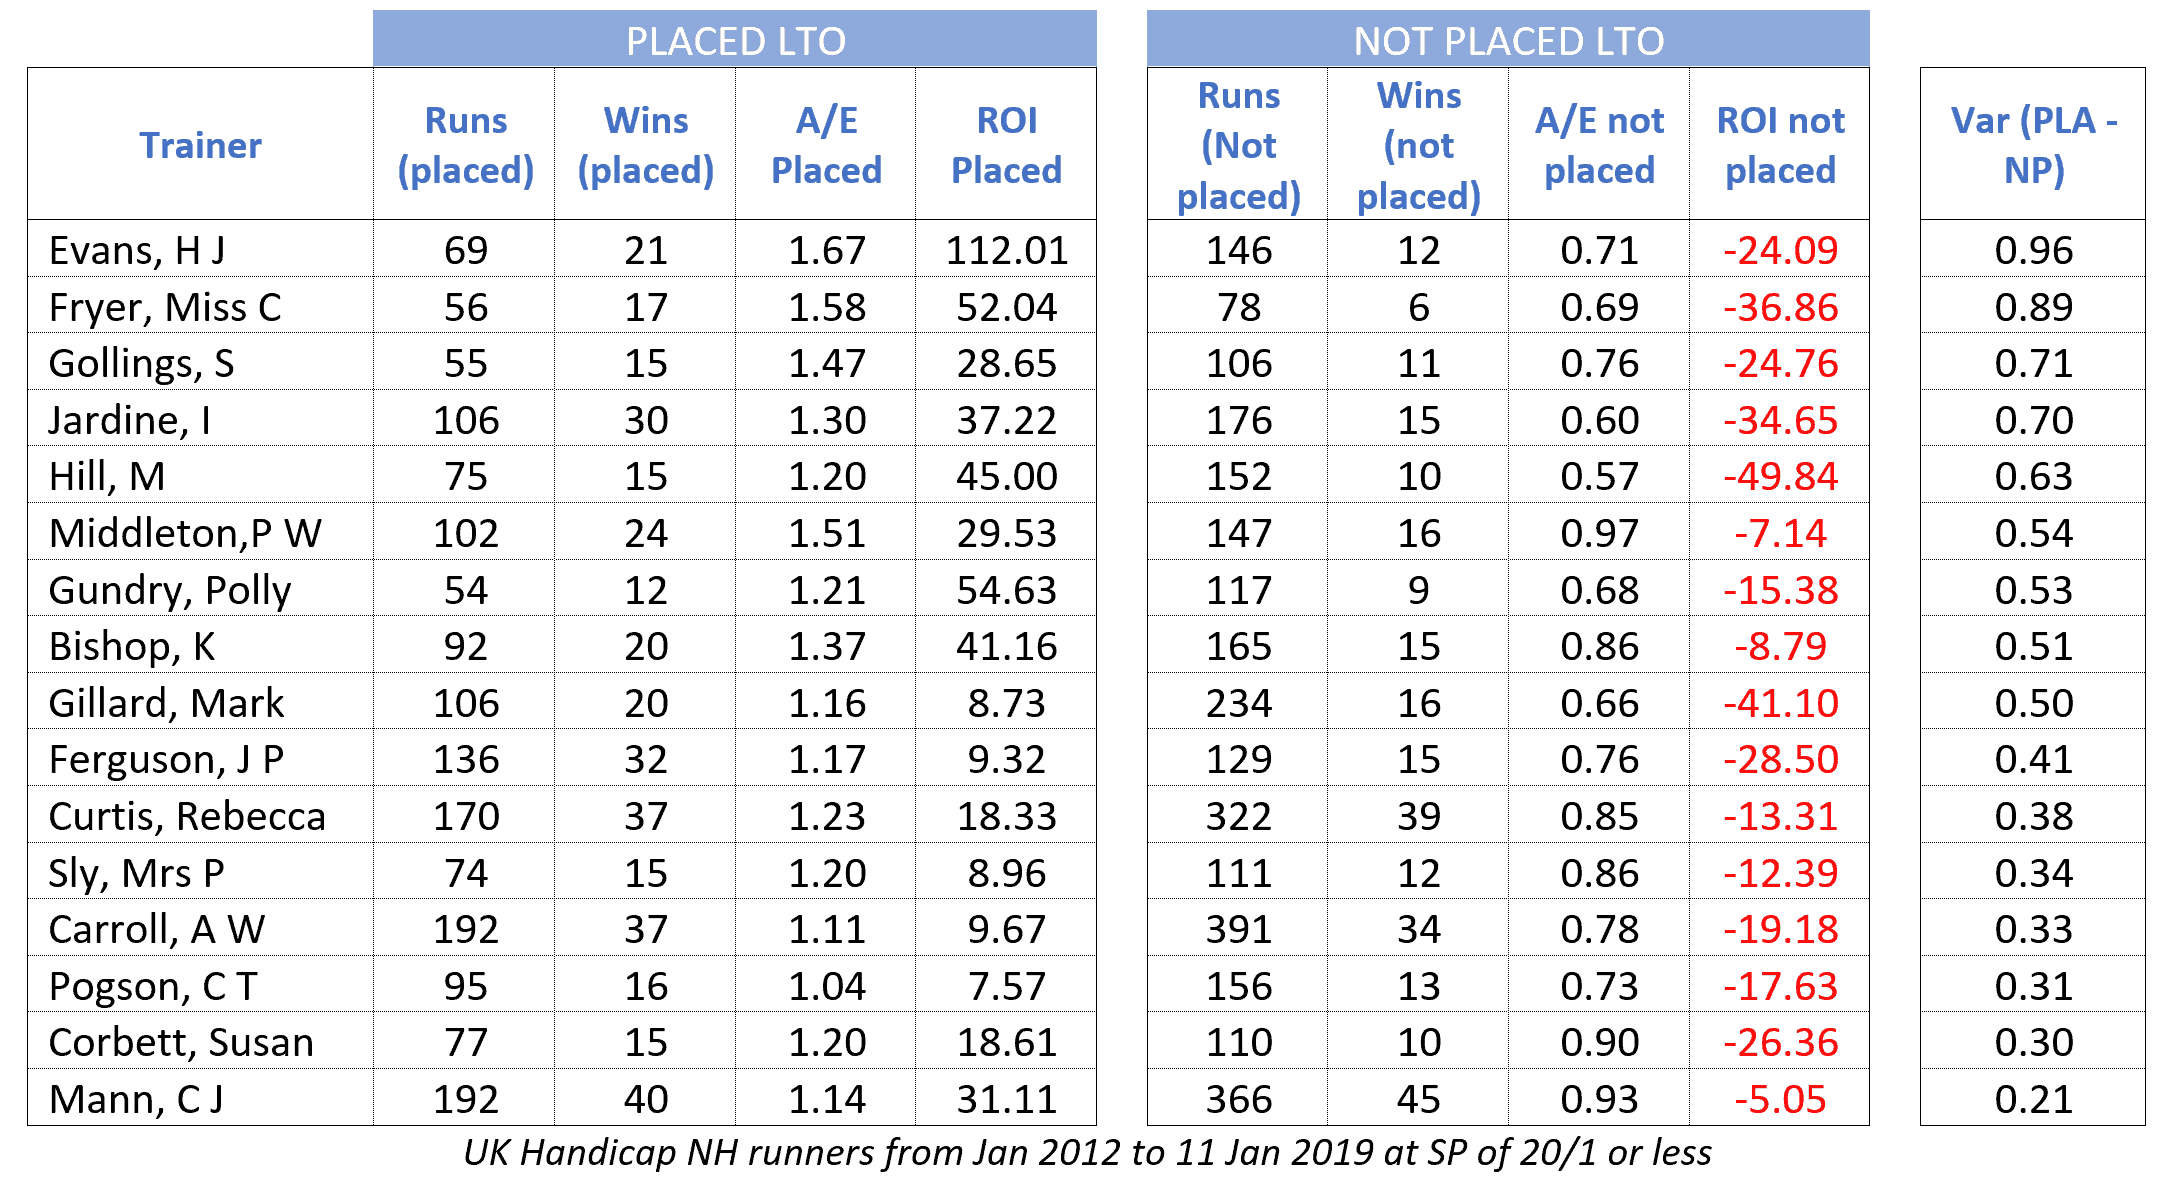
You may recall I named this group of trainers the “leftfielders” for what are obvious reasons, hopefully. In basic terms, these yards appear to deliver a winner seemingly irrespective of whether the horses ran well last time out or not. In the same format as that last article, the table below covers National Hunt handicap runs from 1st Jan 2012 where horses have had a starting price of 20/1 or shorter.
The data is split by trainer, showing performance by horses that placed last time out (left hand block) and horses that were unplaced LTO (right hand block). This table of leftfielders is sorted by the variance in performance between the two separate datasets. In this case it’s showing the yards who are exceeding market expectation with their runners who were unplaced in their last race.
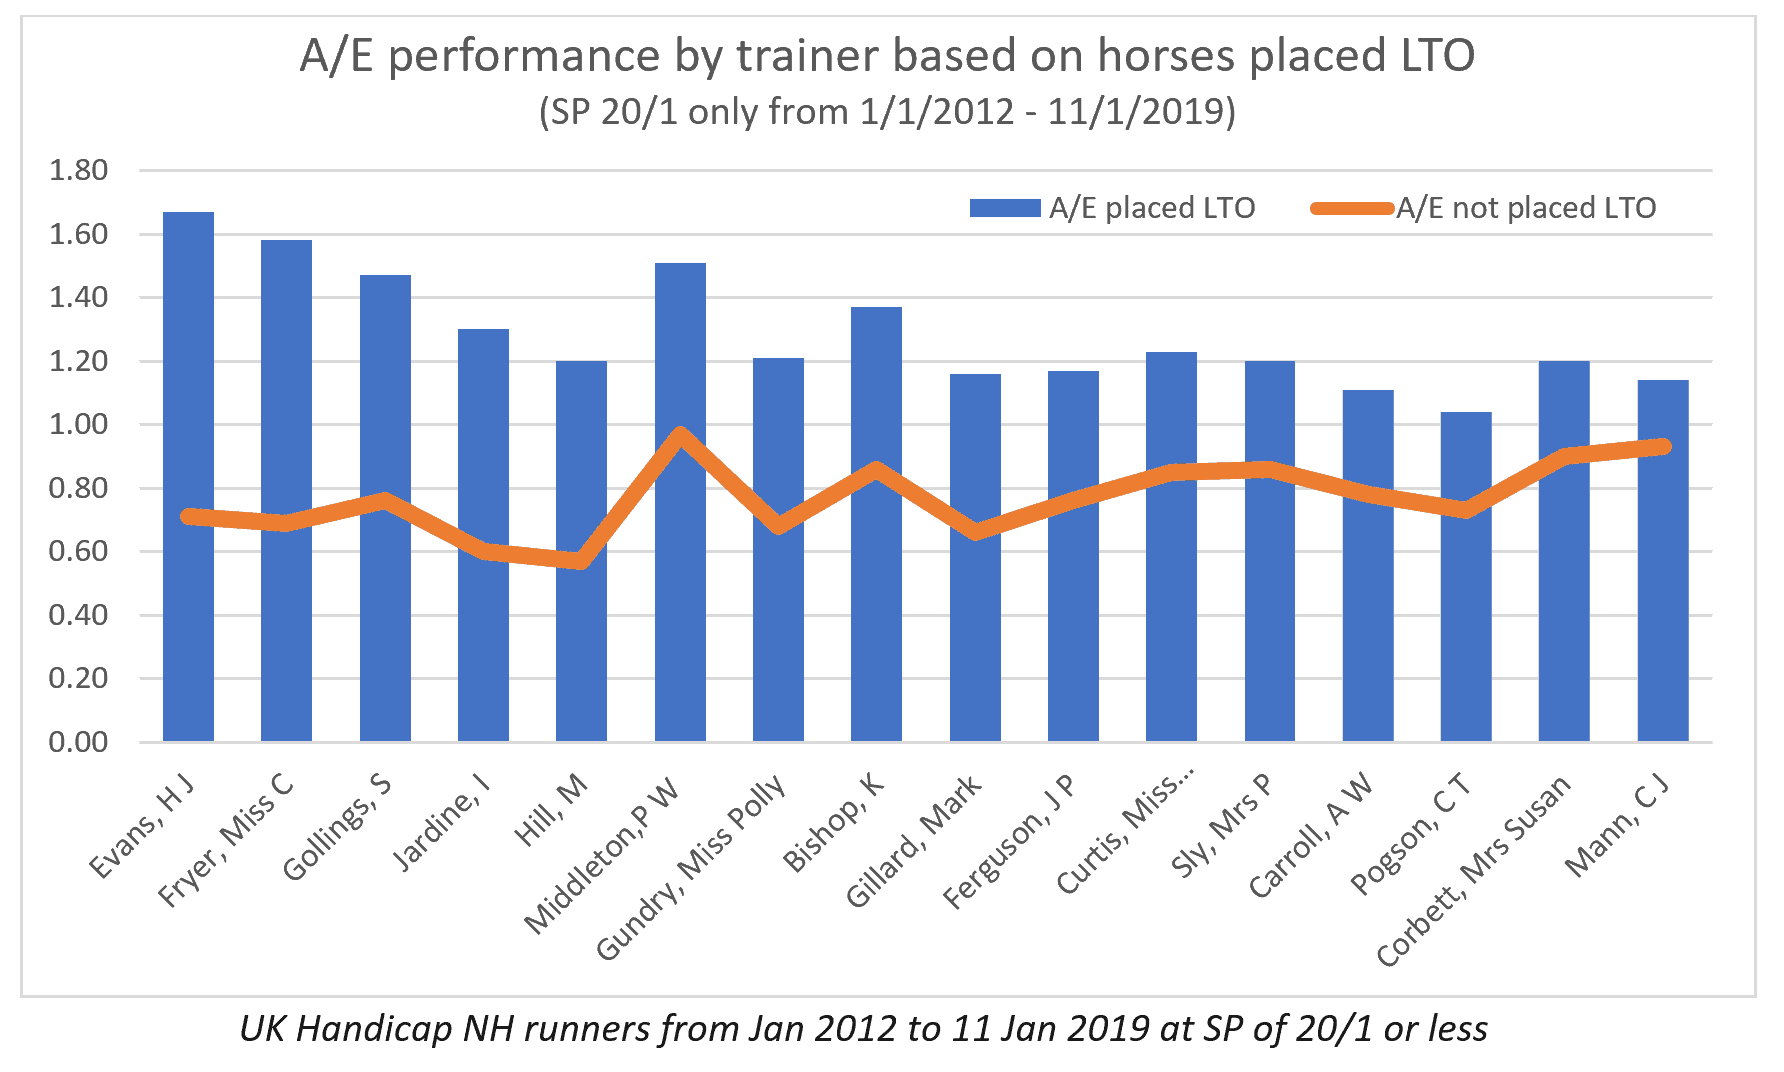
And here is the same info represented graphically (using A/E).
I find some of this data striking. All these yards outperform market expectation with runners that had a moderate/unplaced last run. That’s certainly interesting, however, the real insight for me is the variance in comparison with their in-form runners.
Perhaps it’s labouring the point but if we take Joanne Foster’s data, the A/E of her placed LTO animals is 0.55 (based on market evaluation of 8 wins from 86 runs) and the A/E of her unplaced equivalent is 1.48 (based on 26 wins from 157). That's a variance of 0.93 in A/E performance between the two datasets. The graph shows the scale in difference with the Keevil, Stronge, Coltherd, Dalgleish and Spearing yards all showing notable deltas between their placed & unplaced performers.
Another way of appraising the data is by analysing strike rate. The graph below illustrates the same dataset but by winning percentage across the placed/not placed variants.
Here we can see that not only do these trainers beat the market with their unplaced last time entries, but their strike rates are at least comparable with their more in-form (as measured by last day placing) charges. In other words, last time out finishing position is less relevant for these yards. Taking the Foster yard again, a horse placing LTO prevails in its next race 9.3% of the time, compared to 16.56% for those unplaced last time. Whichever way you look at it, that’s a big difference and should be ripe for punting angles.
Let’s zoom in on the Joanne Foster data as a case study. The Yorkshire-based stable is another small, focused outfit. Exactly the sort of yard that I like to follow. Having had a total of 39 winners from 407 runs in National Hunt racing (since January 2012) the ability to track the stable runners and performance closely should be attainable. Incidentally, nearly a quarter of the yard's runs have been at Sedgefield (15 wins from 97 with a ROI of 0.1% at starting price) so entries at that track from Foster should always be noted.
Returning to the placed/not placed data, there are three aspects of the Foster yard that I think can be drilled down upon to make the healthy starting point of her overall unplaced LTO data (27 wins from 156, A.E 1.48, ROI 33% to SP) potentially even more profitable. They are starting price, going and days since last run.
There are three data tables below showing the splits:
The reason that I’ve shown the three separately with the same data (the 27 wins from 146 runs) is that if we'd gone through sequentially it could seem like a heavily back-fitted approach. By keeping the larger data set and analysing the variables against that broader info we can be slightly more confident that the data is indicative of a general trend in performance.
The numbers outlined by the red border in the tables show moderate performance, which I’m happy enough to remove from the equation. Horses returned at an SP of 17/2 or greater have a 5-from-90 record losing 19% of funds overall; while horses running on “non-winter ground” have a 5-from-56 record, and those having had more than 45 days off the track are a wretched 1-from-32. All of these 'chuck outs' are rational and explainable too.
Removing the red border runners gives us:
A very small micro angle – but a high strike rate (39%), A/E at 2.53 and 166% ROI. One of the reasons I’ve laid out the components is that the angle is probably strong enough for you to choose which elements or not you’re comfortable including or excluding. For me, I’m going for it, this is in my systems portfolio until further notice!
Back Joanne Foster runners at 8/1 or less, on Good to Soft or softer where the horse has run within the last 45 days
I could go into more detail on any of the trainers on the master table at the start of the article hunting for micro angles! After all, there are some massive names on there (Gordon Elliott, and Anthony Honeyball of this parish, to name but two). However, the key message is that all these yards have a propensity to deliver irrespective of a low-key last run by one of their charges.
When trying to unpick a handicap race we all like the comfort blanket of a nice recent run for our potential wagering proposition. But over the past year or so my mentality is changing / has changed and I take my comfort from data such as this instead.
Finding a horse from one of these yards that I like and which bombed LTO gives a ripple of excitement, after all I think I know something that the punting masses generally don’t. Naturally, it doesn’t always work and clearly an unplaced run LTO can be a symptom of a horse with limitations or being out of form rather than an off day. Nobody said it was easy!
Like Shelling P's
As I’ve been writing this, looking out of the window on another frosty Leicestershire morning, something else has occurred to me. As an extension of the theme I’ve been wondering if there are some of the training establishments whose horses bounce back specifically from being pulled up in their last run.
My hypothesis would be that some trainers could offer instructions to the jockey to pull up more readily than others (it could of course be the jockey too), or that they are more inclined still to run a horse when the weather conditions have gone against the horse, or, well, for any number of other reasons. Regardless of reason or theory, it’s worth a quick look.
Now isn’t that interesting? The table shows trainers where a horse was sent off at an SP of 20/1 or less and had pulled up in its previous run. To qualify for the table an A/E of greater than 1.00 is required.
There are some National Hunt behemoths on here: Nicholls, Henderson, Tizzard and Hobbs for example. It does make sense to an extent. They generally house animals with greater talent so you’d expect them to be more capable of bouncing back after a bad run in comparison to other stables. It does appear, though, that the market might not always fully factor that in. That’s perhaps understandable; after all backing a horse with a P as its latest entry on the form-line requires a degree of bravery. However, in general terms there will be value plays where these trainers listed in the table are in the game.
The clear leader here is David Pipe so let's have a look at his data in more detail.
31 wins from 161 runs, A/E 1.75 and ROI of 62%.
We could leave it there, that’s strong! But let’s check a bit closer anyway.
Here is the distribution by starting price.
A bias towards the shorter end of prices here, it appears as though we are on relatively safe territory ignoring all runners at 12/1 or greater, where a combined record of 3-from-65 and a £20 loss to a £1 level stake is persuasive enough for me. That leaves the following consistent performance over several years (notwithstanding the solitary runner in 2019 so far).
And Just like that another micro is added into my portfolio:
Back David Pipe runners sent off at 11/1 or less and which were pulled up in their previous run
Sometimes it can be that easy finding angles, other times I can sit for hours searching high and low for snippets worth exploring. I like this one though and am looking forward to seeing how it pans out over the coming weeks, months and maybe years!
That just about wraps up this edition. A final word, though. If you have any theories or hypotheses that you think might be worthwhile looking into please drop me a line, either via the comments below or on twitter
I can’t promise I’ll investigate everything but I’m sure there is some gold worth panning for in the collective minds of geegeez.co.uk subscribers / readers.
Speak soon!
- Jon Shenton
https://www.geegeez.co.uk/wp-content/uploads/2019/02/urbangale_jofoster.jpg320830Jonny11https://www.geegeez.co.uk/wp-content/uploads/2022/10/geegeez_banner_new_170x78.pngJonny112019-02-04 09:59:162019-02-04 11:32:53Jon Shenton: Heading Further Leftfield
A little over four weeks ago was the end of SotD's seventh full calendar year since its inception as a non-tipping piece back in November 2011. I should possibly clarify for those who haven't been with us all that time!
SotD was designed to give some statistical pointers as to how you could frame a bet without relying purely on the formbook or the racecards, which as we all know were (and largely still are ) inadequate back then. So, whilst we don't expect all of them to win, we do expect a fair run and often the stats we quote will pinpoint winners elsewhere too, so it's really more than a tip.
We know that we acquire lots of new subscribers every year thanks to previous years' successes from this service and also due to more savvy punters looking for better data, information and racecards than they'll find anywhere else on the 'net, so a brief overview of SotD is as follows...
Whilst form and other variable parameters come in to play when normally making a bet, SotD's first port of call is find runners who fit a stat (or usually a number of stats) suggesting they will go well.
We aim to have the selection online in the early evening before racing (preferably by 6.00pm) where possible but occasionally due to home-life, travel plans and/or holidays, it can be later, but there's a selection every day except Sundays and we don't take Bank Holidays, Easter nor Christmas off!
We try to find runners priced around the 11/4 to 6/1 mark at BOG prices and look for some value in the odds achieved, but sometimes we have to stray outside those parameters a little. A large proportion of our selections run at much shorter odds than we advise and constantly beating SP is a key in making long-term profits. Basically, our profit figures aren't massaged by some freakishly long priced winners, nor is our strike rate bolstered by a string of odds-on jollies.
What we do have is a consistent approach that aims to highlight one value selection per day and although this "one-a-day" stats-based approach to bet selection suffers all the obligatory peaks and troughs associated with betting on horses, we did manage to make a profit yet again in 2018, but it was a real tough slog and easily our worst year so far, which was made even more acute following on from 2017's stellar performance!
Normally at this point, I'm typing this out with a fairly satisfied smile on my face, but the bulk of 2018 from Easter onwards gave me little to smile about to be honest and the only real cause for celebration is that we managed to secure another yearly profit, our 7th on the bounce. We're rightfully proud of our 7 year record for what is essentially a free add-on to the Gold toolbox package, but we're aware that 2019 needs to be better.
Number of bets/selections/pts wagered: 292 (two fewer than 2017!) Winning Bets: 67 (well down from 83 in 2017) Strike Rate: 22.95% (2017 = 28.23%) Average payout from winning bet : 3.57/1 (2017 = 3.89/1)
Yearly Profit: 14.16pts (2017 = 112.05pts) Profit on Stakes Invested: 4.85% (2017 was 38.11%)
Our overall bottom line is still very impressive and one that both Matt and I (it's a team game) are rightfully very proud of, but we're well aware that 2019 needs to be better for both of us and more importantly for you, our loyal subscribers.
That said, the first four weeks of this year have gone well and we're already guaranteed to be in front for the at the end of next month, so we're now hoping to kick on and make 2019 something more like 2017 than 2018!. The challenge now, of course, is to extend January's form for as long as we can throughout the year.
Thanks for sticking with Geegeez and SotD, Chris, Matt and the whole Geegeez team.
***Stat of the Day is just one component of the excellent package available to all Geegeez Gold Members, so why not take your £1/30-day trial now?
https://www.geegeez.co.uk/wp-content/uploads/2016/01/sotd-updates.jpg320830Chris Worrallhttps://www.geegeez.co.uk/wp-content/uploads/2022/10/geegeez_banner_new_170x78.pngChris Worrall2019-01-29 10:39:532020-05-02 06:50:58Stat of the Day: The 2018 Review
I've always been a big fan of placepots, and these days I play Place 6's at Colossus Bets most days. The reason for that is related to the better features and also the ability to frame syndicates, which I regularly do.
In the video below, I walk through how I scope up a meeting. It contains a good few pointers on strategy, and some tactics I deploy as well. As it turned out, it was a losing bet. Worse still the race that went down I was influenced in a way I very rarely am: by a whisper for a horse! Even worse still, I gave the winner - a horse with no form - a big shout on a trainer angle. Sigh. The dividend was £360, and my ticket is shown beneath the video.
Hopefully you'll find something of interest in the recording. And if you'd like to play Colossus Bets pools yourself - I recommend them - there's more info here:
Account Registration
You need a Colossus account. If you haven't got one, you can sign up here and Colossus will fund your account with the same amount you bet in your first 72 hours, up to a maximum of £100. YOU MUST USE THE REFER A FRIEND CODE TO GET THE BONUS (SEE BELOW).
You can be a friend to geegeez by using the 'Refer A Friend' code, geegeez - Colossus will then send a small rebate to us from their takeout when you bet. They welcome winners and you absolutely do not need to lose for us to get our small commission. In fact, they give us a tiny bit more when you win, which is why I'm keen to promote them. So please, take down some of the big pots, would you?! 🙂
https://www.geegeez.co.uk/wp-content/uploads/2019/01/colossusbets.jpg320830Matt Bisognohttps://www.geegeez.co.uk/wp-content/uploads/2022/10/geegeez_banner_new_170x78.pngMatt Bisogno2019-01-25 19:11:462019-01-25 19:11:46Video Walkthrough: Picking out a Place 6
I’ve been meaning to check this out for ages, writes Jon Shenton. With a bit of downtime over the Christmas and New Year period (if you can have downtime with three kids) I finally got around to pulling my thoughts together to test a few theories with some lovely data.
I’ve always been curious about whether there are some trainers where we can get a better view of a horse’s likely performance based on its form in recent runs.
In fact, I have touched on it in some of my earlier pieces on this site. Using data such as the LTO Winner element of the Trainer Snippets report here on geegeez.co.uk we know that some yards are more adept at backing up a win with another victory. In this article, then, I will broaden the search a little to placed form, rather than evaluating last time out winners only.
Let’s get straight into having a look at a few numbers.
The data below shows all National Hunt Handicap runs at 20/1 or less since 1st Jan 2012 (up to 11th Jan 2019) split by whether the horse placed last time out (LTO). I’ve selected handicaps only largely to avoid the inconsistencies associated with horses on their first few runs. There may be an argument to expand this, but one has to start somewhere.
The key here is that A/E and ROI are virtually the same across both datasets. From a punting perspective you’d lose just short of 15% of your cash backing all horses that placed LTO, and a similar level of damage would be inflicted if you only backed horses that did not trouble the judge during their last venture.
The main difference is strike rate, a horse “in form” based on last run prevails 16.66% of the time as opposed to 11.44% if it was off the board that last day.
Broadly speaking, a winner that placed last time out returns a starting price of about 4/1 on average. One that didn’t place the last day has an SP of 13/2 or thereabouts. Considering both aspects perform consistently in A/E and ROI terms the market appears to be getting it right.
Let us now drill down somewhat, by yard, in search of trainers worth tracking in specific circumstances.
To do that I’ve pulled together a fairly large master data table showing performance with horses that placed last time, and data showing where the horse hasn’t hit the frame in their last race, and merged it together by trainer to try paint a picture. Still with me? Good!
To make sense of it all I’ve categorised things into three areas of interest and will discuss each in turn. The categories are as follows:
The Outperformers: trainers who generally are beating the market irrespective of what their charges did last time out
The Rollers: these guys appear to roll when their animals place in their previous run and follow up with another good run
The Leftfielders: these yards appear to deliver a winner seemingly irrespective of whether they run well last time out or not
In this article, I'll review the first two categories, starting with...
The Outperformers
The first theme or thread represents general outperformers, which is to say handicap excellence all round.
Just to explain the tables and data in more detail first. The “block” to the left shows the trainer performance for horses that placed last time out in terms of runs, wins, actual vs, expected and return on investment. The “block” on the right shows the performance of all runners that failed to make the frame in their last appearance.
The column on the far right (A/E var PL – NP) shows the difference in A/E performance between horses placed and unplaced last time out.
This should be an elite list, and for that reason it’s small in size. These yards have an A/E of 1.00 or greater irrespective of horses placing or not last time, with a positive ROI across the board to boot. To qualify they needed to have saddled a minimum of 50 runners for each aspect at an SP of 20/1 or less.
If we take the Kenneth Slack yard, horses which placed last time won 23 of their next starts from 86 runs. That was right on expectation against the market (A/E 1.01) whilst recording a small profit of about 7%.
His unplaced last time runners were 20 from 79 in terms of wins in the review period, but this time A/E is 1.35 and ROI is close to 50%.
A Slack runner based on these numbers is always worth a second glance. However, it seems as though the horses’ last race performances may be irrelevant to how well they’re likely to run this time. The win strike rates are very similar, too (c.25-26%), but because the market seems to be factoring in the last run form there is more value in backing the runners who did not place on their last outing.
All of the above five trainers are Outperformers, consistently beating the market irrespective of whether their horses’ previous run indicates they’re in form – as evidenced by a placing – or not. At the top of the tree is Tom Lacey, though the market is now catching up with his progressive stable. As things stand backing all Lacey’s runners blind is a still a rewarding enterprise… just! The bird, however, may have flown.
Interestingly, and perhaps surprisingly, Nicky Richards is outperforming expectation across nearly 800 runners. That merits further investigation another time but, for now, following this yard closely is the recommendation.
The Rollers
Just by way of a quick refresh, a Roller is a trainer who performs strongly where their horses hit the frame in their most recent start, in comparison to the ones that were unplaced.
The table below shows trainers with 50 or more runners in each category (placed or not last time out). Data is sorted in order of the variance in A/E performance between the placed and not placed LTO (the far right column).
Some of these variances are mighty in scale.
For those that are more visually stimulated, the graph below shows the same data as the table in terms of A/E performance by trainer. The blue blocks represent horses placed last time, the orange line representing those that did not. It shows the range of difference in performance by trainer, the size of variance getting smaller as we work left to right across the graph.
Right at the top we have James Evans (H J Evans http://www.hjamesevans.co.uk), a relatively modest (in terms of size) operation based 20 or so miles away from Cheltenham.
Modest in size maybe, but if an Evans horse placed LTO they enjoyed a 21 from 69 win rate, A/E of 1.67 and ROI of 112%
Compare this to those unplaced in their previous outing:
12/146, A/E 0.71 and ROI -24%.
That’s a stark difference potentially illustrating that this yard takes its time to get horses ready but, once firing, they look worthy of support.
Drilling a little deeper, the James Evans yard in its entirety has only ever had one winner at greater than 14/1 (UK NH racing) so we can refine slightly.
I’m happy to leave it there, this angle has been profitable every year apart from one so that will go into my systems to follow library from now on, a simple angle:
Back James Evans runners with an SP of 14/1 or less that placed LTO
Another trainer with a stark difference in performance based on last time out placing is Caroline Fryer (17/56 placed LTO 28% SR vs 6/78, 8% SR not placed LTO http://www.carolinefryerracing.co.uk). Hers is another team with a select number of horses running under rules. On closer inspection there is a slightly different story to tell here, however.
Of those 17 wins from last time placers, ten relate to a single horse, Riddlestown. Now a 12-year-old his last run was on Boxing Day. It may be that age is catching up with him but he’s still going into my geegeez tracker. When he’s had a competitive run (placed) in the recent past (30 days or sooner) he is 10/31 so I’ll be keeping an eye out for an uptick in performance. Riddlestown has an entry at Leicester on 22nd January, so I will be watching closely for signs of improvement with a view to potentially following him next time.
Every trainer on that list above merits further analysis, especially those who fly under the radar of the general masses (which I think is the case for most of them).
A yard I’ve followed with some success in the past is that of Iain Jardine (http://iainjardineracing.com), though admittedly more on the flat where Jardine has a strong record in staying races. That is particularly true where his horses are fit (had a recent run) and have been backed (10/1 or less). So it’s not a huge surprise to see him on this list with his NH runners.
Taking his ‘placed in previous run’ data for National Hunt (30/106) and refining I’d expect a similar pattern to his flat runners to be apparent: a recent run and relatively well supported in the market.
I’m not going to show the data table (you’ll have to trust me!) but there isn’t a winner in his dataset sent off at greater than 10/1, albeit only from 13 runs. A similar pattern to the flat runners so I’m going to ignore those for now, though I am mindful of the small sample size.
The table below shows the 10/1 or shorter NH placed LTO runners by days since last run.
I’ve used coloured font illustrate some of the subjectivities when dealing with data.
The Green section is easy, it clearly shows that if a Jardine horse sent off at 10/1 or shorter was placed in a very recent run (20 days or less) it is worth following.
The other sections are less clear, the red font illustrates those horses that have been off track for more than 60 days: one winner from only 7 runners sent off at 10/1 or shorter, so inconsequential. Personally, considering the overall profile of the data I’m happy to leave a short-priced Jardine placed last time out runner alone if it’s not been since within a two-month period.
As you may have speculated already the amber section is most open to interpretation, with ten wins from 44 runners and a very small SP profit to a level stake. I think in this case I’d probably leave alone, primarily to limit the number of bets and to keep a more focussed portfolio. However, with exchanges and BOG it may be that backing these ‘three weeks to two months off’ runners will turn a healthy position.
Iain Jardine NH Handicap runners with an SP of 10/1 or less that have run in the last 20 days, placed LTO
This article and the data referenced within is broad brush stuff. For example, in the high-level data there is no consideration of factors such as when the horse’s last run was, which grade, distance, class, etc. Form must be more relevant when those things are positively aligned with today’s task.
Next time I’ll look at the “Leftfielders”. There is a raft of interesting stuff to discuss with these yards. Word count and a determination on my part to try and be a bit more succinct means I can’t do it justice today! Until next time, happy punting.
- Jon Shenton
https://www.geegeez.co.uk/wp-content/uploads/2019/01/JamesEvans_Ascotwinner_830x320.jpg320830Jonny11https://www.geegeez.co.uk/wp-content/uploads/2022/10/geegeez_banner_new_170x78.pngJonny112019-01-21 20:29:522019-02-04 10:16:12Jon Shenton: From one place to another?
After a break of a few months I am back to look at some more pace angles in an attempt to find potentially profitable avenues, writes Dave Renham. My last pace article looked at handicap chases at up to 2m 1½f; this time, I will focus on longer distance (2m 7f to 3m 3f) handicap chases.
The data I have researched is from the past five years (2014 to 2018) for UK racing, using the Geegeez Gold Query tool.
When I talk about pace I mean the initial pace in a race, and specifically the position horses take up early on. The pace data on Geegeez is split into four – Led (4), Prominent (3), Mid Division (2) and Held Up (1). The number in brackets is the pace score that is assigned to each section.
The first set of data to share contains overall pace statistics for handicap chases of 2m 7f to 3m 3f for the period of study (a minimum number of six runners in a race).
[N.B. It should be noted that when using the Geegeez Query tool you currently need to enter the parameters 3m to 3m 2f. The Query tool uses increments of 2 furlongs and when you put in 3m - 3m2f it actually covers races from 2m 7f to 3m 3f]
Pace comment
Runners
Wins
SR%
IV
Led (4)
2282
430
18.84
1.68
Prominent (3)
4894
626
12.79
1.14
Mid Division (2)
2076
160
7.71
0.75
Held Up (1)
5086
406
7.98
0.71
Despite the fact we are looking at long distance handicap chases, we can clearly see that horses which led or disputed the lead early have a definite edge. Prominent racers have a fairly decent record too, while horses more patiently ridden early tend to underperform.
Best performing tracks for front runners (2m7f - 3m3f handicap chases)
As when I looked at 2m – 2m 1½f pace data, there are significant differences in the course figures for these contests, with some courses being much more suited to early leaders and front runners than others. Here are the courses with the best strike rates in terms of front runners at the circa three mile range (minimum 25 front runners to qualify):
Course
Front Runners
Wins
SR%
Carlisle
54
15
27.8
Sedgefield
26
7
26.9
Taunton
67
18
26.9
Kelso
62
16
25.8
Newton Abbot
69
17
24.6
Wincanton
79
19
24.1
Hexham
84
19
22.6
Plumpton
62
14
22.6
Lingfield Park
32
7
21.9
Ascot
48
10
20.8
Newcastle
45
9
20.0
For record the strike rate for Fakenham for front runners was 28.6%, but there were only 21 races so it has not been included in the table due to too small a sample.
As can be seen, the strike rate and IV lists are very similar, with Carlisle, Taunton, Kelso, Ascot, Hexham, Wincanton, Sedgefield, Newton Abbot and Lingfield Park appearing on both.
Poorest performing tracks for front runners (2m7f - 3m3f handicap chases)
At the other end of the scale below are the courses with the poorest stats for early leaders/front runners in handicap chases of 2m 7f – 3m 3f:
Course
Front Runners
Wins
SR%
Fontwell Park
52
7
13.5
Cheltenham
67
9
13.4
Huntingdon
56
7
12.5
Aintree
33
4
12.1
Bangor-on-Dee
66
8
12.1
Wetherby
57
6
10.5
Sandown Park
39
4
10.3
Sandown and Wetherby have not been favourable for front runners it seems, but again let us delve into the Impact Values to help to substantiate the picture. The table below shows courses that have an IV of less than 1.20 for front runners/early leaders.
Course
Impact value for Front runners
Fontwell Park
1.03
Bangor-on-Dee
1.01
Huntingdon
1.01
Sandown Park
0.95
Wetherby
0.92
Just five courses with moderate IVs and, essentially, these figures suggest that front runners at these courses win roughly as often as they should given a fair playing field (an IV of 1.00 is ‘standard’). Hence, according to the Impact Values the remaining 36 courses all have an edge for front runners varying from a small edge to a considerable one.
Course Pace Averages (CPA)
So far, I have focused solely on front runners, but now I want to try and give a more rounded course and distance profile for each course. To do this I have once again created course pace averages.
These are complied by adding up the Geegeez pace scores of all the winners at a particular course and dividing it by the total number of races. The higher the average score, the more biased the course and distance is to horses that lead early or race close to the pace. Here are all the courses listed, in course pace average (CPA) order:
Course
CPA
Course
CPA
Fakenham
3.14
Sandown Park
2.65
Sedgefield
3.06
Uttoxeter
2.64
Hereford
3.00
Chepstow
2.64
Taunton
2.93
Hexham
2.61
Ascot
2.89
Musselburgh
2.61
Doncaster
2.89
Exeter
2.60
Wincanton
2.88
Kempton Park
2.60
Lingfield Park
2.88
Newbury
2.57
Market Rasen
2.88
Towcester
2.56
Plumpton
2.87
Fontwell Park
2.53
Cartmel
2.83
Catterick
2.52
Warwick
2.82
Huntingdon
2.50
Stratford
2.80
Leicester
2.50
Perth
2.76
Ffos Las
2.49
Newcastle
2.75
Cheltenham
2.49
Kelso
2.74
Wetherby
2.46
Southwell
2.73
Bangor-on-Dee
2.43
Carlisle
2.73
Aintree
2.42
Newton Abbot
2.71
Worcester
2.41
Haydock Park
2.69
Ayr
2.23
Ludlow
2.69
These averages arguably give a more overall pace ‘feel’ to each course – as noted earlier, Fakenham (which tops the list) has had few races in reality.
It is interesting to note that Carlisle is only joint 17th on this list having been top in terms of front runner stats. This is because 20 of the 46 races have been won by horses that gained a pace figure of either 1 or 2. The fact that there have been 15 wins for front runners has been negated somewhat by this, aided notably by the moderate performance of prominent runners (just 6 wins from 46 races).
Taking all the information at hand, I would suggest that the following four courses offer the strongest pace bias – Sedgefield, Ascot, Taunton and Wincanton.
Ascot’s overall figures are worth sharing as an example:
Pace comment
Runners
Wins
SR%
IV
Led (4)
48
10
20.83
2.14
Prominent (3)
78
10
12.82
1.33
Mid Division (2)
51
1
1.96
0.22
Held Up (1)
108
6
5.56
0.57
Having all the Ascot stats at our fingertips helps to illustrate how strong a bias there has been in recent years with 20 of 27 races won by horses that led early or raced prominently – this equates to 74%.
2m7f - 3m3f handicap chase pace data, by field size
Before I close, I want to share some different ‘splits’ in terms of number of runners. The data I have looked at for this article has come from races with 6 or more runners, so is quite a wide range. In the following three tables I have split the 2m 7f – 3m 3f handicap chase pace results into races of 6 to 8 runners, 9 to 11, and 12 runners or more.
6 to 8 runners
Pace comment
Runners
Wins
SR%
IV
Led (4)
1233
267
21.7
1.51
Prominent (3)
2296
347
15.1
1.05
Mid Division (2)
548
63
11.5
0.82
Held Up (1)
1967
202
10.3
0.72
9 to 11 runners
Pace comment
Runners
Wins
SR%
IV
Led (4)
703
111
15.8
1.55
Prominent (3)
1643
188
12.4
1.12
Mid Division (2)
746
60
8.0
0.80
Held Up (1)
1867
147
7.9
0.77
12+ runners
Pace comment
Runners
Wins
SR%
IV
Led (4)
346
52
15.0
2.12
Prominent (3)
955
91
9.5
1.35
Mid Division (2)
782
37
4.7
0.67
Held Up (1)
1252
57
4.5
0.64
Interestingly, the 12 or more runner group has comfortably the highest Impact Value for front runners, notwithstanding the understandably lower strike rate. Therefore, these data suggest that the front running bias increases as field size increases. I wonder who would have thought that?
Dave Renham
https://www.geegeez.co.uk/wp-content/uploads/2019/01/TrafficFluide_Ascot_830x340.jpg345830Dave Renhamhttps://www.geegeez.co.uk/wp-content/uploads/2022/10/geegeez_banner_new_170x78.pngDave Renham2019-01-07 10:15:342019-04-23 08:10:33The Importance of Pace in Three Mile Handicap Chases
In my last article I accidentally stumbled into unpicking all-weather course form and the relative importance of it at each track in the UK, writes Jon Shenton. It wasn’t my intention to evaluate anything in that area; however, when exploring a vast ocean of data sometimes you end up going where the wind takes you as thoughts develop around the words and numbers on paper.
If you didn’t read that article (link here), a tentative conclusion was that a previous course win was more indicative of a likely follow up victory at Newcastle than any other all-weather surface.
Until that moment I had very limited interest in the tapeta at Gosforth Park as a vehicle for punting. Aside from the odd evening “leisure” bet, almost universally doomed to failure, I’ve hitherto watched perplexed from afar.
To my untrained eye the victors seemed to be pattern-less in terms of my usual all weather starting points of pace and draw, the immaturity of the surface also meaning data regarding trainer, sire and anything else you can think of is less reliable from which to build even vague conclusions.
So, when the intel from that last article showed Newcastle in a favourable light it got me thinking: it was time to have a proper delve into the delights of the northeast venue.
There is a uniqueness regarding Newcastle compared with its AW cousins. Namely, that it has a straight mile. Apart from Newcastle’s five to eight-furlong and Southwell’s five furlong straight track all other races on AW in Britain and Ireland are contested around a bend. This could be of potential interest for a number of reasons. As I’ve already alluded to, the usual staples of pace and draw could be less important without a turn than we see at other AW venues?
Why could pace and draw be less relevant at the Newcastle straight track?
To start with, on a straight track all of the horses compete over exactly the same distance. This is not the case when racing around a bend where inside draws have a shorter distance to run.
Imagine an Olympic 200m final around a tight bend where all athletes start at the same point. Not even a peak Usain Bolt content on fried chicken could overcome a lane 8 / car park draw unless he was running against people like me.
As well as the emphasis of draw on a turning track the AW tracks typically are tight in nature, with shortish home straights. This often leads to greater extremes of front runner bias. Thus finding a competitive front running animal with an inside draw on the AW is usually a compelling wagering proposition.
All of this points to Newcastle being a fairer test over the straight track than the other artificial surfaces racing around a turn. Fairer for the runners and riders, but trickier for punters?
Could it be that factors such as course form, pedigree or trainer angles play a more significant part in determining the outcome of a race? That’s all supposition at the moment, but let’s dive into it.
A continuation of the course form theme seems like as good a place to start as anywhere.
Course Form at Newcastle
A quick refresher, the graph below is from the previous article, it shows the adjusted strike rates at UK all-weather courses split by horses’ number of previous wins at the same track. The adjusted view was to reflect/standardise the effect of different field sizes. In other words, a race at Newcastle should be harder to win as the average number of runners is 10.9 whilst at Chelmsford it’s a more meagre 9.05.
The green line to a clear degree illustrates that Newcastle previous winners have a higher probability of a future win than course winners at other AW tracks.
By adopting the same method but splitting the Newcastle races by straight/round track performance we hopefully will find something of interest. Firstly, we need to take field sizes into account. Straight track races are popular with an average of 11.28 entrants per event, 1.11 more than the round track average field size of 10.17.
NEWCASTLE
Avg Field
Multiplier
5-8F STRAIGHT
11.28
1.16
8.5F+ ROUND
10.17
1.05
OVERALL
10.90
1.12
Using the same format, the graph below shows the profile of previous course winners’ strike rates by distance of race.
I think this is quite insightful. There appears to be an indication that previous course form is more valuable in predicting a winner over the straight track of 5 to 8 furlongs, than it is over the longer trip.
Now the volume of runners is quite small, particularly on the round course where two or more previous course wins are concerned but there is definitely enough to upgrade a previous course win on the straight track in comparison.
Pace on the straight track
Lesson number 1 in Geegeez.co.uk land is that pace is a game changer in punting life. It’s certainly been a key component in my improvement in race reading and is just about the first thing I look at when trying to evaluate any equine contest.
We’ve already generated the supposition that front running pace bias may not be as important at Newcastle as it is on the other UK all-weather tracks due to the fairer nature of the straight; but do the numbers back that up?
Well, yes. The above chart is eye-opening. It illustrates the Actual/Expected performance by pace score for each of the all-weather tracks in the UK. The data covers all 3YO+ and 4YO+ handicaps and all races up to 8f in distance.
You can see the old adage of “pace wins the race” is pronounced across all of the tracks apart from Newcastle.
The blob annotated with “a” above shows the fate of hold up horses on the straight track at Newcastle. There is clear daylight between their performances when compared with late runners at every other track. In fact, horses that are held up actually fare well even in comparison to their front running rivals at the track. Certainly, trailblazers are not the be all and end all that they can be on some tracks, as the blob “b” illustrates. Both front runners and hold up horses have an identical A/E performance of 0.99.
Lumping in all races from the minimum trip to the mile is potentially dangerous and clearly analysis by specific trip length may lead to slightly different and more solid conclusions. However, in terms of proving a point that race profiles are different on the straight Newcastle track to the typical AW ones I think this does enough. The bottom line is don’t be put off by a horse stalking from the back of the pack at Gosforth Park.
Draw
Hopefully it’s reasonably understandable but evaluating full draw implications of a straight vs. round track is a tough ask for an article of this length given the variables in distance, race type, number of runners and the like.
That said, by way of a quick guide, below is a broad-brush summary of Newcastle draw performance. It only considers handicap races of 10-12 runners. It’s also important to note I’m using actual draw position (i.e. accounting for non-runners), not racecard draw number.
What does the above tell us? In truth, not a great deal! Maybe, just maybe, there is a hint of bias towards the wings of the track, especially for races over 5, 6 and 8 furlongs. Sometimes this makes sense as races develop against a rail and perhaps that is what is at play here. But… for no obvious reason the 7f distance contradicts other distance data by suggesting there is a hint of middle track bias. In conclusion, it’s all pretty marginal and if you find the right horse, with the right profile, the draw at this course appears to be less relevant than most in terms of stall position.
Sires
It’s quite early to draw meaningful conclusions on stallions to follow at Newcastle but the below table shows some potentially emerging talent.
It’s derived from geegeez.co.uk’s Query Tool and illustrates all runners at 20/1 or less; and to qualify for the table an A/E of 1.25 is required, as well as a 10% ROI.
The volumes are generally too thin to draw firm conclusions and build bankable, watertight angles, especially as some of the performance will be driven by individual animals repeatedly winning. Even so, it’s a good list to keep in mind to help generate a shortlist when evaluating a race, particularly when form, or course form, is at a premium.
There is merit in just pulling out a couple to discuss briefly. The most successful couple of sires on the Newcastle all weather, in terms of winner numbers, are the renowned Sea The Stars and the progressive Lope De Vega.
Sea The Stars
Firstly, Sea The Stars… His progeny’s 15 wins are comprised of 13 individual horses. John Gosden’s Champion Stayer, Stradivarius, is the most illustrious, having recorded his first success (on his third run) at Newcastle, over the straight mile. That is the very same course and distance that stablemate Enable made her debut on, incidentally. Clearly, Johnny G likes to blood a top class type on the tapeta here.
In fact, it’s not uncommon for horses of real quality to get an early spin on the Gosforth Park sands. The apparent level playing field of the track is a feature which attracts some of the elite stables to test their youngsters at a formative stage of their careers.
Reverting to Sea The Stars, below shows his progeny runs by race code.
Not bad all round but there is a clear distinction between AW and Turf data. If we zoom in a little further and evaluate the performance by the UK’s different AW venues, we get the following.
Here we see that Newcastle is driving the superb AW performance. Yes, Southwell, Chelmsford and Lingfield all show promise and we should take note of the offspring of Sea The Stars when they run at those venues. But Newcastle is where it’s at.
Lope De Vega
Lope De Vega was campaigned exclusively in France under the tutelage of Andre Fabre and doesn’t on the face of it have a particularly strong all-weather pedigree. However, much like Sea The Stars, his progeny has performed generally better on the artificial surfaces, in win strike rate and profit/loss terms at least.
Newcastle performance is strong (see the table below), but so too are Chelmsford and Wolverhampton. The surface at the midlands track is also Tapeta so that makes some sort of sense (albeit that it was polytrack until 2014). If you delve into sire records, quite frequently a good Newcastle record can be indicative of a better than average Wolves one and vice versa. The Chelmsford one is harder to explain, though it may be simply that Lope De Vega is a top class sire all round.
If we take that trio of courses and check P&L performance over different trips, we can see below that Lope De Vega offspring are less productive over 5 and 6 furlongs than other distances.
So, I think we have a potentially nice micro here: Lope De Vega progeny, 20/1 or shorter, 7-14f at Chelmsford, Wolves or Newcastle. 27.6% strike rate, 52% ROI to level stakes with strong A/E and IV numbers. The table below shows the precise numbers.
All Lope De Vega at 20/1 or less, 7-14f at Chelmsford/Wolves/Newcastle:
Trainers
A final word on the trainers who have taken to Newcastle’s newish surface, the above table shows those yards who have had 25+ runs, an A/E of 1.00 or above and an ROI of 10%+.
Before I talk about the table a couple of mentions for trainers not on the list. As stated earlier a number of elite trainers use Newcastle as a proving ground for their potential stable stars. John Gosden has had 75 runners (at 20/1 or less) including Enable, Without Parole and Stradivarius. Sadly though, and for obvious reasons, these are all quite well found in the market. Hugo Palmer is another who is inclined to send runners north as part of their education and development, but without profitable import for punters.
To those actually in the table, where there is a mix of northern track specialists and selective southern raiders. Sir Mark Prescott and William Haggas both clearly send animals up to the north-east that have a fair chance, and it is somewhat surprising to see these practitioners showing a level stakes profit. Moreover, as their strike rates at 31% and 38%, and related Impact Value numbers of 3.02 and 3.53, demonstrate, they’ll keep you in the game more readily than most.
The more local names of Menzies, Tate, Whitaker, Bethell and so on are all worth tagging too, although with only a handful of winners I wouldn’t necessarily generate micro angles to follow until there is a greater body of evidence.
Good luck, thanks for reading, and a happy new year to you all.
- Jon Shenton
https://www.geegeez.co.uk/wp-content/uploads/2019/01/Enable_Newcastle_320px.jpg320651Jonny11https://www.geegeez.co.uk/wp-content/uploads/2022/10/geegeez_banner_new_170x78.pngJonny112019-01-02 12:29:322019-02-04 10:16:25Newcastle Punting Pointers: The Angles of the North?
I received an email yesterday from a subscriber, Jack, who was struggling to make Gold work for him. He had a fairly set way of doing things on another site (absolutely fine, of course) and the migration to Geegeez was a challenge. Of course, we humans largely resent change - I certainly do!, so there's needs to be a good reason for making the switch. I like to think that we offer a plethora of such good reasons.
Anyway, in answering Jack's email, I thought the content might be useful to others, so I've reproduced his questions and my responses below. I will try to do occasional case studies like this to help introduce the various elements of Gold, and how you might incorporate them into your own betting.
OK, here goes - Jack's note first, and then my reply:
Hi Matt
Thanks for taking the time out for this. As I said to Chris I don't know how you guys manage to fit everything in to 24 hours/day!!??
Anyway here goes.
I use Classes 3 - 5 handicaps up to 1 mile on the flat and Classes 2 & 3 handicap chases up to 3 miles over jumps. Prefer to see no 3YOs in flat races and so prefer the 4+ races to the 3+ but they're a bit scarce after the first month or two. 3YOs can make big improvements as they grow stronger with age and gain experience but unfortunately there's no way to calculate that.
On the flat I like to find horses which have previously run well at the course and distance and have a chance when comparing today's OR to their last few runs and hopefully their run/s at today's CD, using the admittedly over-simplistic 1lb/1pt OR for each length beaten no matter the distance. I prefer the race to be at the same class or below that of it's usual races.
As an example if we stick with Joegogo in the 7.45 at Chelmsford on Thursday I can immediately see that 6 runs ago it ran in a class 3 over CD and came 4th of 6 but only beaten 2L, that it is now 6pts OR better off in today's race and, hovering over the race to bring up the comments, I note that it led in that race, faded late on and lost 2 places. I would expect it to do better in this weaker race so should at least make the frame. Looking at its last 3 races there are conceivable (admittedly a bit feeble) excuses for all of them! 3RA Wolves - came after a break so maybe not completely wound up, 2RA Southwell couldn't get the lead, LTO Lingfield, not a course brilliant for front runners and faded in final furlong over 6f. Now back at 5f.
Will be interesting to see if Adam Kirby again takes the ride although I would prefer a good apprentice to a) take a bit of weight off and b) hopefully deflect the bookies/other backers away from the horse - Adam's presence on it's back would probably lose a couple of points but would at least point to the horse being fit and well and having a chance.
All the above takes me only a minute or two, having done it for so long.
I would then switch to GeeGeez Gold to check the draw, pace and to quickly find out how the other runners in the previous Chelmsford race did as well as its last 3 races. Unfortunately this can only be a rough guide as without digging deeper there's no way of telling if those that have run since did so in better or worse races. If a horse/s still looks promising on Gold I would then go back to the RP to do the deeper digging.
Over the jumps I simply look for horses which have been running in better class races than today's. Not too bothered about the OR. Look to back those which have previously done well at the same type of course as todays, if not having run there before e.g. tight left/right handed, left handed galloping etc. So if a horse has been running well at say Market Rasen, Ludlow and Taunton I wouldn't be in a rush to back it at a left handed galloping course. Having backed horses since Blakeney won the Derby back in 1968 I know all the courses by heart so that only takes a couple of seconds. I don't bother over much with either the distance (as long as it's under 3m) or the going over jumps as I've missed winners doing that. I think the 'sloggers' come into their own once past 3m and find it difficult to evaluate those races.
In both codes I don't check how the trainer's doing - if badly then maybe today's runner will be the catalyst for a revival in stable fortunes! And if a 7lb claimer hasn't scored yet then maybe today's the day! So maybe I look a bit too much on the bright side! Also, as Gold has good info on trainers, jockeys and combos etc, I do realise that I'm not using it to its full extent but think that sometimes simple is better.
As I mentioned before all the above does not take long on the RP site as I've been doing it for years and I can fairly quickly go through all the runners in a race but it seems much slower for me when I use the Gold site. Maybe it's just a case of getting quicker as I use Gold.
The other thing that bothers me about Gold is that sometimes the draw advantage seems to come from relatively few races, especially when compared to FlatStats as I mentioned before. I like the way FlatStats lays it out e.g.'472 horses from 44 races analysed. Date range: 11-Jan-15 to 06-Dec-18' and followed by the charts. As it's free for this I tend to use it quite often.
Well that's enough of my ramblings and please don't spend much of your precious time looking for ways to help - I'm probably beyond help anyway!
All the best
Jack
Some really good and interesting points - and here is my reply...
Hi Jack
There is nothing in what you do that cannot be done on Geegeez. Regarding race selection, you can use the filters on the cards menu – I’ve filtered for C3-5 flat handicaps today in the first image below.
Race card menu filters for handicap, race code and race class
Course and distance form: best view is Full Form, where you can select the ‘course’ and distance’ filters. Joegogo Chelmsford example below. I’ve also checked Proximity Form there, which gives a traffic light view of how well the horse ran based on race distance and beaten lengths. Also on Full Form, you can see DR and RS columns: they tell you the draw – in this case six (of six) – and run style, in this case Led. Filtering a horse’s form by wins and/or places often highlights a pace preference/requirement; it also offers clues as to whether a horse ran well from a poor draw, or poorly from a good draw, etc. Finally, at the right side of the form line in Full Form, you can see that the race in question has R W P W% P % - that shows the subsequent form of the race. In this example, 18 runs, 0 wins and 3 places. So not spectacular in truth.
Full Form with Proximity form, Course and Distance checked
Checking Instant Expert will reveal overall form at the respective course, distance, class and field size (going too). The final column compares today’s OR with the horse’s last winning OR in this code. Again below is Joegogo, where we can see he’s four pounds below his last winning OR on the all-weather. (I have my settings to last 2 years form, and race code/hcap contextual – i.e. when it’s a handicap, this view is only showing me handicap form, and when it’s all-weather, it’s only showing me all-weather form; when it’s both, it’s only showing my AW handicap form).
Instant Expert shows form against the race conditions, and also an OR comparison against the last win in this code
For the jumps, you could use the Class Move report as a starting point – it’s here – and sort by those dropping in class. See image below. The reports are a treasure trove, and it’s worth spending a little time messing around with them, as you’ll discover all sorts of ‘ins’ to various races.
Class Move report can be sorted to show those horses stepping down (or up) the most in grade today
Regarding looking for horses which have done well on today’s type of course, again Full Form has filters for course direction, general profile and specific profiles, so you can easily see how your potential class droppers have fared on similar tracks. I personally think trainer form is more important than you do (!), but I always check the place percentages as well as the wins. They tell far more of a story than the headline win numbers. (We have green and red form indicators on our racecards, but I never use those without checking the place data, as I say).
Going for me is only important when it’s heavy or good to firm (jumps, firm on the flat). Extremes isolate the proven types, and I have a ‘rule of two’: once may be a fluke, twice almost certainly was not.
On the matter of draw, I think one needs to find the right balance between enough data in the sample, and the data being relevant to today’s race conditions. For example, looking at seven runner races is not useful when considering a 16 runner race. Looking at all data is not terribly useful when considering a soft ground flat race (the draw bias can change almost 100% from firm to soft at some tracks). We have dropdowns on our draw tab, but more than that we have ‘guide lines’ which show ‘all going’, ‘all field sizes’, and ‘all races’, so you can see how the ‘micro’ dataset relevant to today’s going and field size maps against the bigger (but less specific/relevant) datasets. I’ve included an example from Southwell today, where you can see that the overall draw data (fainter lines) would mislead you when compared against the specifics for today – also note that I again tend to use place data as it is more comprehensive.
The fainter lines show that the overall draw data might mislead a bettor. There is very little bias against today's conditions.
I do appreciate it’s a fair bit to take in, and obviously it’s different from RP because there’s a heck of a lot more on our site. But I think you’ll be able to absorb these different elements quickly enough if working on them one by one. Gravitate to Geegeez rather than trying to do it all in one go, that’s my suggestion.
But I will try to occasionally share something like the above.
If you're not currently a Gold subscriber and you've read this far, you must be interested in what you might be missing. Hopefully this has been an appetising little taster. If you've never tried Gold before, you can get access to everything for your first 30 days for just £1.
https://www.geegeez.co.uk/wp-content/uploads/2018/02/Best_Website_Gold.png320830Matt Bisognohttps://www.geegeez.co.uk/wp-content/uploads/2022/10/geegeez_banner_new_170x78.pngMatt Bisogno2018-12-11 09:47:292018-12-11 09:47:29Geegeez Gold Case Study #1
Last week, I invited you to send in your questions. About geegeez.co.uk, about racing, about betting. And you did. In your droves. So today, I've recorded a video to answer them all. It's long - two hours - so underneath the video box is a list of the questions and subject headings, as well as some resources to which I've referred in the recording. I hope you'll find (at least some of) it useful.
Matt
p.s. I've also managed to create a podcast version should you prefer to listen to the audio.
n.b. The number before the questions below is the point in the video at which you'll find that answer.
Your Questions
The number before the questions below is the point in the video at which you'll find that answer.
*Race Types and betting*
1:45 - How do you work out handicaps? - Kevin Clarke
22:55 - My Question is I am not sure what I am looking for in looking for winners. I use first expert to sort out horses that fit the greens this is the dogs. Then I look at pace to see if the selection has the credentials then I go to draw if flat and look at that. Then I pretty much lose the plot what do you look for after this. Thanks love the videos learnt so much From Geegeez. - John A
27:40 - I am a massive Placepot nut , any advice on this type of bet with regards to Gold would be much appreciated. What do you think of Colossus Bets which now offer this bet and any advice on the Cash Out option ? - Simon B
36:15 - I wonder if you could come up with a good query tool to able to lay a short price horse successfully. I do lay, I am down money and I need to turn things around. - Gerry M
- First up I enjoy reading your articles. My question is what feature in geegeez you would use and how would you use it to find small priced lays if that is possible. - Murray S
43:00 - Would you kindly expand on the relative values of Pace in Chase, Hurdles and NH Flat. I'd find that very helpful. Many thanks. - Keith B
46:55 - What do you do to improve your strike rate - James T
49:35 - I would like to see more guidance on how you as an expert would go about picking a selection or 2, maybe a guided bet for a Saturday and big meetings. - Steve S
51:25 - Breeding and sales data snippet there is numbers after the stallion name, like 6,7f. What that figure means? What is your personal opinion about a very big break before start? Like over 200 days. I mean in the betting perspective. Is it better to leave those kind of horses without a bet? Thank you for excellent site! - Jussi A
54:15 - Hi Matt, forgive me if I’m wrong but I didn’t notice the ‘bringing it all together’ section on your last web tutorial thingy. I’ll admit to still struggling with gold as there is so much to look at & whilst i feel like I understand all of the individual components of full form, pace, draw & the reports, I’m still really struggling to know which ones to give the most weight/credence to & which ones to ignore as obviously they’re all pointing at different horses. If you could show how you sit down & attack a race cold or what starting points you use that lead you to a bet then that would help somewhat I think. I feel like you say ‘that horse could be of interest depending on other factors’ for example but then we didn’t really see you carry on that selection process to the end in any of those web shows. I appreciate you may have reservations about doing that as there’s so many different ways of using gold & you don’t want to ‘prescribe’it to us but I feel, if like me, you’re a new member who has previously tried & failed to make gold work for them, it’s incredibly frustrating to know that the relevant information is in there but i just can’t land on it with any confidence! - Iain M
59:07 - So, all in all, I’m probably in the mode of not being able to see the wood for the trees, almost too much information and not knowing how best to use it. I’m also probably guilty of looking for big priced winners rather than just winners and of the old fear of missing a winner so backing it regardless. As a rule, I have always been led by Horses for Courses, Ground specialists and runners back to a winning handicap mark and since joining Geegeez I do like the TJ combo. So, I guess this is a very open ended ‘question’ and probably not one you can easily answer, but given all of the above (and below) can you give me a steer to start making this excellent service pay for me a bit better please? I’m not looking to retire early or win a million, just nice steady returns and a bit of fun along the way. - Lee
*Technology *
1:03:30 - Can you see yourselves developing a geegeez mobile app in the future? Roy N
*Features*
1:05:15 - First time headgear (report, and QT)
1:07:20 - Is it possible to add to the racecard, a going filter, to see if any of the red/green figures are changed, and the form figures can relate to such an update? Instant expert does show most of this but not if the trainer's or jockeys record without having to use full form screen. - Terry S
1:10:30 - why does the contextual breeding data/trainer data etc update so late in the day before the race? Before I used Geegeez I used to pick my horses at around 11am (just after declaration) and then place the bets in the evening. My mornings and evenings are busy so this worked best for me. I understand that you obviously wouldn’t change the way you do things just or me, but is it possible for this data to be uploaded earlier in the day? - Tom F
1:12:20 - would it be possible to add in a horses current Official Rating onto Full Form? Just that when you're looking at its past ratings, you need to minimise the window to look at the race card to see its current OR. - Eddie K
1:12:40 - Hi Guys, can I check the previous high /low prices of horses inplay ..ie if a particular horse has generally shortened in running - Michael M
*Staking / Tipsters*
1:13:30 - I am really disappointed with SOTD , I am a yearly subscriber, it is very difficult to get BOG without being gubbed , however I do like you and your apparent honesty that's why I rejoined, but this service Stat Of The Day, leaves a lot to be desired, as I understand SOTD is found using your stats , so what does it say for using your stats. I hope that this does not come across as a knee jerk reaction , but this has been a long time coming, you asked for comments so here is mine ! - David H
1:18:40 - Do you have a forum/ group chat where you and other members send out their selections for the day? - Joe D
1:19:30 - I follow 3 or 4 racing tipsters, all have long term profitable records. However often they will tip different horses in the same race. What strategy should one adopt? Cover all, (split stake or not?) and therefore reduce overall return. Or if they tip same horse, should i increase stake? I would use separate betting banks, but wonder whether better to focus on just one tipster? - David E
1:21:28 - For many years l believed that doubles, trebles etc., were a mugs game and always stuck to win only successfully until l read somewhere that if you knew what you were doing with your selections they could be lucrative so brought this into my betting and found this so far to be true. What is your opinion on this? - Thomas
1:24:35 - I believe that you once wrote that raising stakes during a losing run was better than raising them during a winning run. Is my memory right. If not, what are your thoughts on staking. - Barry C
1:28:30 - When a new service goes live, why do all the tipsters I follow, have to blitz it, day afterday after day? It's blimmin annoying ,and 9times,out of 10, it turns out to be less than useless. But I'm at the stage now, where I am just deleting, and unsubscribing; so you can guess that I've missed some of the ones that, actually work. Could you just tell me, are they being paid ,for mentioning that service(which they've said they have proofed for infinity years)?? Actually, my own service is amazing: You'll never get any winners, but at least I'm up front, about it!! - Steven S
*Regulation*
1:34:10 - Around the time of Goodwood Matt Chapman suggested that there were several odd SPs. Who determines the SP? Is this something the Bettor's Forum is concerned about. I think most bettors will put up with the occassional horse which wins out of the blue having been well backed. They like the idea of an old fashioned coup landed. The idea that the whole system is skewed against them is a different ball game. - Ben S
1:38:20 - As I consider the going on the day to be very important.Is there a way to get round the lies that most Clerks and the Bha are sending out. All the best and thanks for all the help over the years, - John
1:43:30 - I was told that Sportsbook at Betfair was covering single bets, with a pay out of up to £500.00 without having your account closed, is this really true? If so what about multiples, would they stand a higher amount on these? I am thinking mainly of football bets. By the way who owns Sportsbook or managers it? - Philip P
1:44:30 - Could I ask if you have heard of any bookies who have gubbed or restricted accounts offering reasonable bets on Class 1 or 2 races? - William J
1:46:30 - I have had my account with Skybet restricted although I don't think I have won much from them. Is this common as for the stakes I am using I cannot imagine I am much of a threat. I do only bet a small number of bets per year, maybe 70-80. - Geoff W
*Research*
1:47:15 - I'd like to be pointed in the right direction regarding using the query tool please. I am sure this is a feature I do not use due to not understanding it - Paul E
1:49:05 - Thanks for being so open with your wealth of knowledge … much appreciated . I am a “systems” man and was just wondering what I should be accepting as a minimum figures for my systems if I would want to make it work on a more professional basis = win % / roi % sp / roi % bfair / “ a/e “ and or “chi” ?? (are the last 2 the same ?) - Brian C
1:53:35 - Would it be possible to re-do the QUERY TOOL recording I get the gist of it but your teaching has a lot to be desired. I take you have never taught in a class room as you have no synchronisation what so ever or lesson plan talk about wing and a prayer Or as you put it WINGING IT - Frank R
1:55:15 - I understand A/E and I/V at least in so much as anything over 1 is good. But if A/E is say .81 and I/V is say 1.3 does that indicate a negative stat .....I'm presuming that it does. - Mick S
https://www.geegeez.co.uk/wp-content/uploads/2018/12/Video_QandA.jpg320830Matt Bisognohttps://www.geegeez.co.uk/wp-content/uploads/2022/10/geegeez_banner_new_170x78.pngMatt Bisogno2018-12-05 15:32:232018-12-06 16:41:15Your Questions, My Answers
There are few racing betting mediums as divisive as Southwell All-Weather, writes Jon Shenton. I know people who barely acknowledge its existence, and yet, in the other camp, are people like me: I absolutely love it with every fibre(sand) of my being!
Indeed, I love winter all weather racing, full stop. It’s probably as a result of me getting some (well earned) gardening leave from January to March 2017, when I really started to immerse myself in the world of racing. Those halcyon days of studying my new toys (Geegeez Gold being the main one) in the morning and watching the racing in the afternoon on ATR will live long in the memory. I was drawn to Southwell because it seemed a bit easier to navigate than the complicated world of National Hunt racing. No vagueness on ground, no fences or hurdles to consider, and a whole stack of course form to evaluate. Perhaps some moderate, relative early success helped too.
Whilst it may not be to the taste of everyone, supporters assert that the deep, stamina sapping test provided by the track offers a unique challenge and adds to the rich tapestry of UK racing. Arguably, it serves as an outlet for horses to show their ability who aren’t ordinarily suited to other racing surfaces.
It also has the important attraction of familiar names returning year after year, which as we know isn’t then norm for the racing on the level. It may be a stretch to claim superstar status for the main protagonists, but there are legends such as La Estrella (16 wins from 21 runs at the course) and General Tufto, who has run no less than 125 times on the fibresand over the last 10 years. 125 times and still counting!
To be honest, that’s even more frequently than I’ve attempted to explain odds and probability to my poor, not really interested, long suffering and very tolerant partner. Yes, on occasion I’m surprised I have one too! Anyway, let’s crack on. What follows are a few thoughts and insights which I hope will inform your Southwell wagering hereafter.
USA Bred horses at Southwell
It’s relatively well documented that horses with a pedigree originating from the good ‘ole US of A are worth consideration on the fibresand. There is certainly logic in this given the perceived proximity between the Southwell surface and the dirt tracks of America. The table below illustrates track runners by sire origin, for all races in 2012 onwards (three major countries only included)
Origin of Stallion
Runs
Wins
Win%
P/L (SP)
Place%
ROI (SP)
A/E
(GB)
7881
892
11.3
-1815.6
29.3
-23.0
0.86
(IRE)
5919
700
11.8
-1327.8
30.1
-22.4
0.85
(USA)
1248
225
18.0
155.6
38.8
12.5
1.03
Southwell (AW) runners by country of origin, 1st Jan 2012 to present
The picture is pretty clear: US-bred horses outperform their UK- and Irish-bred counterparts significantly, winning more often (18%), beating market expectations (1.03) and returning a profit (12.5%) at SP.
Having said that it’s not ‘backing blind’ territory in my opinion, especially given the fact there are some exceptionally big priced winners in the sample. The biggest of all was a 100/1 shot, the Derek Shaw-trained Hammer Gun, who is definitely worth putting in the tracker for future Southwell entries as we will see shortly.
The Hammer bolted up in that particular race and, if you’re going for the Hail Mary play, I can think of worse places to do it than backing a US-bred runner at Southwell who is unproven on the surface.
As USA horses have a positive record at the track it would make some sense for American stallions to have similarly favourable numbers.
The below table shows sire records at Southwell for the same period. This time I’ve only considered runners with a maximum SP of 20/1. The usual reasons apply: I’m looking for angles which will return with a modicum of regularity. Whilst there can be value at larger prices if you look hard and wait long enough, it’s not a game I want to play, or perhaps I can’t afford too long between drinks. 20/1 works for me, I know some of you prefer shorter. If you do, the data is there in the Geegeez Query Tool – go play!
Stallion
Runs
Wins
Win%
P/L (SP)
Place%
ROI (SP)
A/E
Key Of Luck (USA)
67
15
22.4
21.8
47.8
32.5
1.39
Dubawi (IRE)
79
26
32.9
64.2
45.6
81.2
1.34
Ballet Master (USA)
53
9
17.0
1.3
43.4
2.4
1.30
Poets Voice (GB)
53
11
20.8
35.2
54.7
66.4
1.26
Refuse To Bend (IRE)
64
16
25.0
-5.2
40.6
-8.2
1.23
Speightstown (USA)
85
20
23.5
8.2
51.8
9.6
1.21
Street Cry (IRE)
129
35
27.1
40.5
50.4
31.4
1.21
Invincible Spirit (IRE)
130
32
24.6
22.0
37.7
16.9
1.20
Showcasing (GB)
55
10
18.2
24.0
45.5
43.6
1.12
Captain Gerrard (IRE)
105
21
20.0
54.3
40.0
51.7
1.10
Clodovil (IRE)
58
11
19.0
3.8
34.5
6.5
1.10
Sire performance at Southwell (AW) 1st Jan 2012-present at 20/1 SP or less
The table of top Southwell AW stallions has smattering of USA sires on the list, no major shock there. And, in the case of Street Cry, he was raced on dirt in America and latterly Dubai, winning the Grade 1 Stephen Foster in US and the Grade 1 Dubai World Cup in Dubai.
Ordinarily I’d now be searching through these data, trying to find a few nice angles to share and adopt over the next few months. In general, though, Southwell is a different proposition. Angles still have relevance but the number of course specialist horses can paint a different picture. I’ve already referred to the fact that one of the joys of the track is the number of repeat runners. Taking the top of the stallion charts (Key of Luck) we can see where the problem lies in angle creation.
This graph shows all of Key of Luck’s runners by individual animal, illustrating runs (blue) and wins (orange). The conclusion rapidly emerges: all of Key of luck’s progeny wins have been delivered by three individual horses, with 14 of the 15 coming from The Lock Master and Serenity Now! Even the most prolific stallion on the list, Street Cry, sire of the Australian darling, Winx, has a third of his victories from just two horses, namely Tatting and Fluctuation.
Based on this I don’t feel like many genuine angle opportunities exist in sire data. The samples are too small and the number of progeny involved are insignificant in many cases. No, for me, finding the right individual horses is the key. Then tracking and following them closely can be a productive method with which to approach the fibresand puzzle. Having said that, any Key of Luck or Street Cry progeny running at Southwell are still of interest and I’ll be watching them all closely and backing where conditions appear to be right.
Southwell trainers
Like any track across the world there are handlers who seem to know what is required for the unique Southwell test. Using the same approach as the sire table above here is the equivalent view for trainers, again sorted by A/E.
Trainer
Runs
Wins
Win%
P/L (SP)
Place%
ROI (SP)
A/E
Carroll, D
101
24
23.8
37.6
41.6
37.3
1.63
Fell, Roger
55
11
20.0
33.8
38.2
61.4
1.48
Bailey, A
84
17
20.2
59.8
40.5
71.1
1.29
Furtado, Ivan
60
12
20.0
18.0
33.3
30.0
1.28
Brown, D H
67
15
22.4
-6.8
43.3
-10.2
1.25
Nicholls, D
103
22
21.4
32.9
37.9
31.9
1.25
McCabe, A J
184
34
18.5
31.1
36.4
16.9
1.19
Dwyer, C A
82
19
23.2
14.3
53.7
17.4
1.16
Shaw, D
251
44
17.5
5.5
41.8
2.2
1.15
Burke, K R
118
28
23.7
28.7
40.7
24.3
1.13
Kirby, P A
60
11
18.3
-11.6
40.0
-19.3
1.11
Butler, John
75
19
25.3
9.8
45.3
13.1
1.10
Bowring, S R
209
33
15.8
-12.4
35.9
-5.9
1.09
Southwell (AW) runners by trainer from 1st Jan 2012 to present at 20/1 or less SP
As is becoming tradition it feels right to have a quick delve into the top name on the list, in this case Declan Carroll. The Malton-based trainer sends a high proportion of runners to the Nottinghamshire track. Indeed, the only course that is frequented more by his team is Thirsk, relatively local to the outfit.
Again, like the Key of Luck data, on the face of it, it seems that backing the Carroll stable representatives blindly is a good idea. In truth, it might be: there is a healthy strike rate, fantastic A/E performance and a reasonable return on investment. On closer inspection though, we run into a familiar theme.
This graphical representation shows Carroll horses that have had 3 or more runs on the fibresand track from 2012 onwards at an SP of 20/1 or less; we can see quite clearly that Monsieur Jimmy and Shearian with their six wins apiece (the orange line) account for over half of the trainer’s wins during the nearly six years analysed. I think this illustration reinforces the fact that successful horses generally return to the track time and time again.
In other words, there is a selection bias in these small samples. It’s a repeat of the sire analysis scenario, and again begs the same question: is it worth following specific yards on the fibresand, or is it worth following specific horses?
The answer is difficult, as are all such responses to small sample sizes skewed by individual elements. What is not in doubt specifically is that Carroll knows what it takes to nurture a successful Southwell career for a horse and, once he knows he has one with the right aptitude, he isn’t afraid to keep running them.
By way of example, let’s examine the record of Shearian at the course under the tutelage of Carroll (he was with Tracy Waggott previously).
Impressive stuff. In spite of a remarkable track record, Shearian still, however, went off at a price of 15/2 on the 12th November this year. This, despite him winning in his previous run over course and distance. Granted, he hit the crossbar on this occasion, in a grade where he’d largely struggled, but netted the rebound three days later with a comfortable victory back in Class 6. However, considering his price shortened significantly on the 12th throughout the day the bet represented potentially great value.
That value was present due to his previous eight runs (four on tapeta, four of turf) being fairly unproductive. To Shearian followers that is absolutely of no consequence whatsoever: his lamentable record away from Southwell is 61 spins for just two wins, both as far back as 2013. The cynic in me would point towards a summer of official rating reduction in preparation for a bountiful winter campaign cruising around the Rolleston venue, his AW rating having reduced from 73 to 65 over the period in question.
I recognise that you can always find examples to fit any given narrative; however, it does seem that Southwell form offers more reliability for predicting future prospects at the track.
Horses for Southwell
I’d love to be able to statistically assert and prove that course form is more important at Southwell than most places and I think I can do that, at least partially.
The graph below is quite simple in what it’s trying to show but not so easy to explain. It contains data for all AW runners, by track, from January 2012 for 3YO+ and 4YO+ handicaps only. I’m selecting these age groups due to the likelihood of more horse runs, and logically more course form to check. It’s the journeyman (or woman) type of horse that I’m interested in here.
Anyway, the graph below shows win rate by how many victories a horse has had at the track previously:
The thick blue line represents Southwell. What it depicts is that, compared to the other all-weather tracks of the UK, a previous course win means the horse is more likely to win again at the same track. Newcastle is an interesting newcomer, and runs it close, albeit sample sizes are tiny for the three and four previous wins data points for that course.
This statistical evidence is all well and good, but it still doesn’t quite sit right. That is due to the fact that field sizes could have a bearing on the data. If we take the black line above (Kempton) we can see that it languishes at the bottom, or close to it, across all bandings.
The only reasons that can be the case are either that Kempton has larger field sizes, i.e. more horses running equals lower strike rates, after all only one horse can win (dead heats not withstanding); or because course form doesn’t stand up as well as elsewhere. The fact Kempton is “poor” in all categories does point to it having a higher than average number of runners per qualifying race. The table below confirms this, to some degree at least:
Track
Average field size
Multiplier
Southwell
9.15
0.94
Chelmsford
9.02
0.93
Wolves
9.66
1.00
Lingfield
9.21
0.95
Kempton
10.52
1.09
Newcastle
10.89
1.12
Overall
9.70
1.00
Average field sizes for AW races from 1st January 2012 onwards
Kempton does indeed have notably larger fields than the average AW line up. Interestingly, however, so does Newcastle, a potential course specialist track in the making. So what does this mean, and for what can we use it?
In the table it confirms that a win at Newcastle is harder to get than a win at Chelmsford, and indeed anywhere else in the UK all weather landscape, based purely on field size. To prevail at Newcastle a horse has to be the best of 10.89 animals on average. At Chelmo, the cream of the crop rises above 9.02 horses, a significant 1.87 (17%) fewer.
To try and obtain a like-for-like comparison of course form, effectively taking field size out of the equation, we have to boost Newcastle and Kempton performance to take account of the higher volume of runners per race. Conversely, we’ll be downgrading Chelmsford, Lingfield and Southwell accordingly by deploying the multiplier column in the table above.
It leaves the following picture:
These data appear to show that in the pursuit of finding winners previous course form is considerably more valuable on the tapeta of Newcastle than other all-weather courses. The new surface at Gosforth Park is still relatively new having only been in place for racing for just over two years, so the picture may change over time; but the fact that all races at up to a mile are on a straight track is a notable difference from the remainder of the all-weather scene and may contribute to it emerging as a "specialists' track".
However, even with the adjusted numbers previous course form still holds up well in comparison for Southwell.
Of course, this doesn’t necessarily directly translate to profitable angles, as course specialists are often well found in the market after all. But using data intelligently to assist in constantly improving our race reading ability has to be a good thing. If we find a course specialist with a favourable looking setup in terms of pace and draw (for another article, or check out Dave Renham’s excellent general series), we’re looking at a bet on the assumption that the price is reasonable.
A Dozen Fibresand Masters
Let’s wrap things up. Much of this article has referred to course form and the longevity of horses who run at Southwell on a repeated basis. The below table shows some of the stars who thunder around the Notts oval with regularity. Each has had at least one run at Southwell during the past 12 months, and the table is sorted by A/E, with a minimum of 10 runs required to qualify.
Horse
Runs
Wins
Win%
P/L (SP)
Place%
ROI (SP)
A/E
Custard The Dragon
10
6
60.0
18.8
80.0
187.5
2.75
Hammer Gun
11
6
54.6
111.6
63.6
1014.4
2.64
Piazon
13
6
46.2
20.3
61.5
155.8
1.90
Luv U Whatever
21
9
42.9
15.6
81.0
74.3
1.41
Stand Guard
14
6
42.9
-3.7
71.4
-26.6
0.88
Captain Lars
15
5
33.3
5.3
33.3
35.5
1.37
Philba
12
4
33.3
5.5
66.7
45.8
1.87
Shearian
21
7
33.3
25.6
47.6
122.1
2.28
Razin Hell
22
7
31.8
26.3
59.1
119.6
1.61
Royal Marskell
16
5
31.3
21.6
50.0
134.9
1.89
Pearl Nation
13
4
30.8
-0.1
61.5
-0.9
1.14
Samtu
13
4
30.8
29.3
46.2
225.0
1.43
Record breaking Stand Guard has since retired and there may be one or two others who have hung up their racing shoes, but the list should still be broadly active and, hopefully, profitable. Piazon and the aforementioned Shearian have already got their 2018 winter campaigns off the mark and I’m sure some of the others will be troubling the judge in the coming months. I’ve got a keen eye on Hammer Gun, and Samtu if reverting back to the flat, in particular. Here’s to a productive Southwell campaign for us all and a bit of Hammer Time over the festive period!
geegeez.co.uk uses cookies to improve your experience. We assume that's OK, but you may opt-out from the settings. Cookie settingsACCEPT
Privacy & Cookies Policy
Privacy Overview
This website uses cookies to improve your experience while you navigate through the website. Out of these cookies, the cookies that are categorized as necessary are stored on your browser as they are essential for the working of basic functionalities of the website. We also use third-party cookies that help us analyze and understand how you use this website. These cookies will be stored in your browser only with your consent. You also have the option to opt-out of these cookies. But opting out of some of these cookies may have an effect on your browsing experience.
Necessary cookies are absolutely essential for the website to function properly. This category only includes cookies that ensures basic functionalities and security features of the website. These cookies do not store any personal information.
Any cookies that may not be particularly necessary for the website to function and is used specifically to collect user personal data via analytics, ads, other embedded contents are termed as non-necessary cookies. It is mandatory to procure user consent prior to running these cookies on your website.